

Written by: Aaron Rovner, Founder, Saas Hero
Key Takeaways
- B2B SaaS CPL averages $237 in 2026. Agencies that track by channel and target intent often land 30-50% below that benchmark.
- SQL Rate (51% SEO vs 26% PPC) and Lead Quality Score matter more than raw lead volume for real pipeline impact.
- Net New ARR and CAC Payback (target 80 days) connect agency performance directly to client revenue growth and cash flow.
- Maintain a 3:1 or higher CLTV:CAC ratio and improve Channel ROAS to support sustainable, profitable scaling.
- Use tools like HubSpot, Factors.ai, and custom dashboards for transparent reporting, and book a discovery call with SaaSHero for a metrics audit.
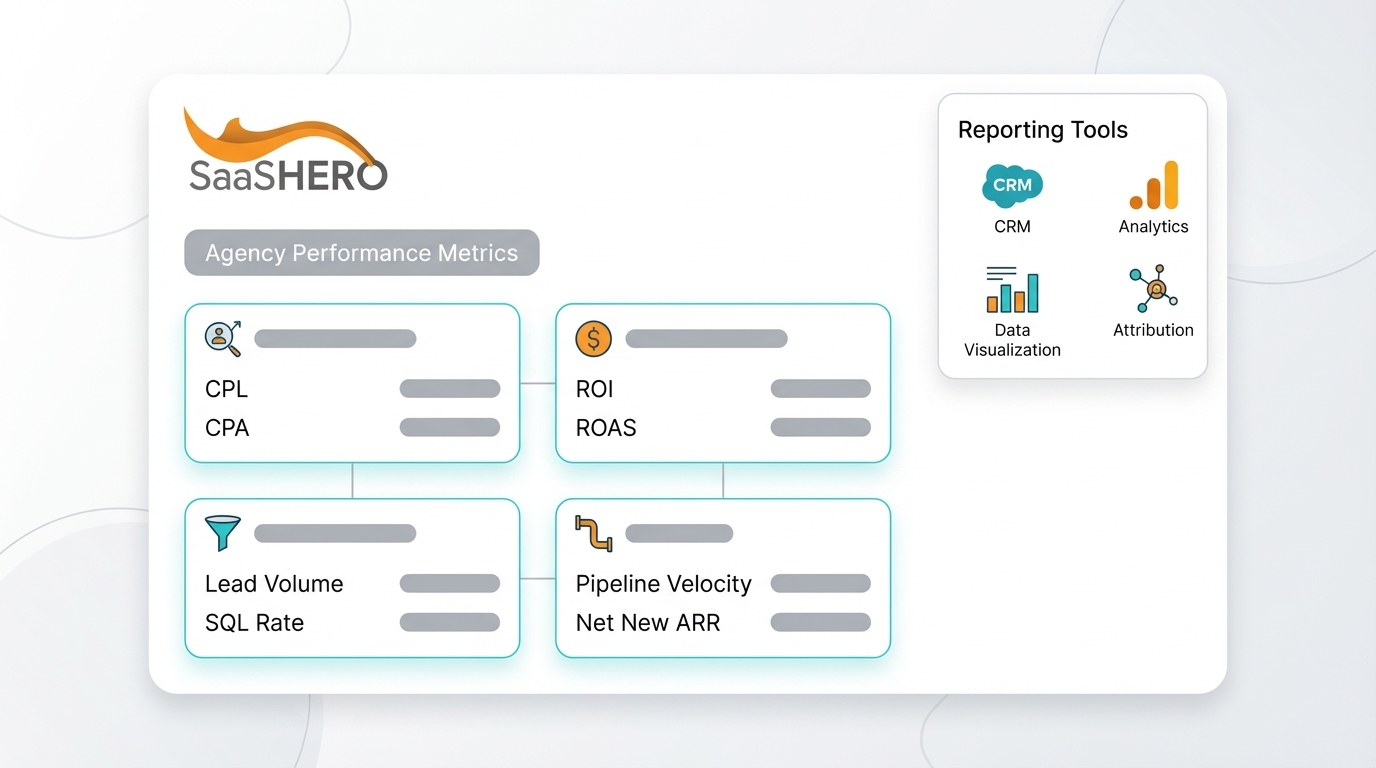
12 Metrics Every Performance Agency Needs to Track
| Metric | Formula | B2B SaaS Benchmark | Agency Focus |
|---|---|---|---|
| Cost Per Lead (CPL) | Total Spend ÷ Total Leads | $237 average | Channel efficiency |
| Cost Per Acquisition (CPA) | Total Spend ÷ New Customers | $50-200 range | Conversion performance |
| SQL Rate | SQLs ÷ Total Leads × 100 | 51% (SEO) vs 26% (PPC) | Lead quality |
| Net New ARR | New + Expansion – Churn ARR | 120%+ NRR target | Revenue growth |
1. Cost Per Lead (CPL)
CPL sets the baseline for how efficiently an agency generates leads. B2B SaaS companies report an average CPL of $237, with wide swings by channel and targeting accuracy. Track CPL by source, campaign, and keyword to spot wasted spend and pockets of efficiency. High-performing agencies often land 30-50% below industry averages by using competitor conquesting and intent-based targeting.

2. Cost Per Acquisition (CPA)
CPA shows what it actually costs to acquire a paying customer instead of a lead. This metric shapes client profitability, retention decisions, and budget ceilings. B2B tech conversion rates average 1.42%, so small gains in conversion can shift CPA dramatically. Compare CPA against customer lifetime value to confirm that each new customer creates positive unit economics.
3. ROI and ROAS by Campaign
ROI and ROAS reveal how quickly ad spend turns into revenue. LinkedIn ROI at 113% beats Google Ads at 78% for B2B SaaS, which shows how much performance can vary by channel. Calculate short-term ROAS on initial deals and long-term ROI that includes customer lifetime value. This split view helps agencies defend current spend while planning long-term growth.
4. Lead Volume Benchmarks
Steady lead volume keeps the pipeline predictable and supports reliable revenue forecasts. Average B2B SaaS websites convert 2.3% of visitors to leads, while top performers exceed 10%. Set a baseline for monthly lead volume, then track growth while holding firm quality thresholds. Volume only counts when it feeds real opportunities.
5. SQL Rate by Channel
SQL Rate highlights how many leads show real buying intent. SEO-sourced leads convert from MQL to SQL at 51% versus 26% for PPC, which shows clear channel quality gaps. Optimize campaigns for SQL generation instead of top-line lead counts. This shift reduces sales frustration and improves perceived agency value.
6. Lead Quality Score Framework
Lead Quality Score combines demographic fit, behavior, and engagement depth into a single rating. A clear scoring model prevents inflated lead numbers that hide poor fit or low intent. Connect scoring to the CRM so sales feedback and downstream conversions refine the model. Over time, campaigns can prioritize audiences that consistently earn higher scores and close at better rates.
7. Pipeline Velocity Insights
Pipeline velocity shows how quickly qualified leads turn into revenue. The metric blends average deal size, win rate, and sales cycle length to estimate revenue timing. Agencies that track velocity can target faster-closing segments and refine messaging for stalled stages. Faster velocity improves cash flow predictability for clients and strengthens the case for continued investment.
8. Net New ARR Accountability
Net New ARR focuses on revenue from newly acquired customers, which reflects sales and marketing effectiveness. Use the formula ARR = New + Expansion – Churn – Contraction to calculate impact. This metric ties agency work directly to revenue growth and supports performance-based retainers. Clients see a clear line from campaigns to annual recurring revenue.
9. CAC Payback Period Targets
CAC Payback shows how quickly gross margin from new customers covers acquisition costs. Best-in-class SaaS companies often reach payback in about 80 days, which creates a cash-generating growth engine. Agencies that prioritize faster payback instead of pure volume help clients recycle capital into more growth. This approach also reduces risk during market shifts or funding slowdowns.
10. CLTV to CAC Ratio Health
The CLTV:CAC ratio reveals whether growth remains profitable over the long term. Healthy B2B SaaS companies usually maintain a ratio of 3:1 or higher. Agencies should monitor how changes in pricing, churn, and expansion revenue affect this ratio. The goal is steady growth that does not rely on unsustainable acquisition costs.
11. Channel-Level ROAS Shifts
Channel ROAS exposes which platforms truly earn their budget. Top B2B lead generation channels include email (66%), paid social (58%), paid search (50%), and SEO (47%). Reallocate spend toward channels with stronger ROAS while keeping a diversified mix for risk control. Regular ROAS reviews help agencies react quickly to performance swings.
12. SQL-to-Closed-Won Conversion
SQL-to-Closed-Won conversion measures how many qualified leads become customers. This rate reflects both campaign quality and sales execution. Track it by channel and campaign to see which sources deliver deals that sales teams can close. This view prevents the common gap between impressive lead numbers and flat revenue.
Top Tools for Clear Agency Lead Reporting
Modern performance agencies rely on connected tools that support real-time reporting and accurate revenue attribution. The 2026 stack leans on AI-powered platforms that solve multi-channel attribution while giving clients simple, transparent dashboards.
| Tool | Key Features | Pricing | Best For |
|---|---|---|---|
| HubSpot | CRM integration, attribution reporting | $800+/month | SMB agencies |
| Salesforce | Enterprise CRM, custom dashboards | $150+/user | Enterprise clients |
| Looker Studio | Data visualization, Google integration | Free-$20/month | Visual reporting |
| Factors.ai | Multi-touch attribution, AI insights | Custom pricing | Advanced attribution |
AgencyAnalytics offers 80+ native integrations including Google Analytics, Search Console, and social platforms with white-label client portals for real-time access. For deeper attribution, Factors.ai provides multi-touch attribution, revenue reporting with Lift analysis, and intent signals capture.
Strong dashboards usually include GCLID tracking for Google Ads, weekly SQL reporting, and clear ARR impact charts. Build views that follow the full journey from ad click to closed revenue so clients can see direct ROI from every campaign.
Why SaaSHero’s Reporting Model Works
SaaSHero’s performance-based model tackles common B2B SaaS agency challenges with transparent pricing, senior-led execution, and revenue-first reporting. A flat-fee, month-to-month structure removes the misalignment of percentage-based billing and keeps the team accountable every 30 days.

Client results include TripMaster’s $504,758 in Net New ARR, TestGorilla’s 80-day payback period that supported a $70M Series A, and Playvox’s 10x drop in Cost Per Lead. These outcomes show how a focus on revenue metrics outperforms vanity statistics. The model keeps attention on ARR, payback, and SQL quality instead of impressions and clicks.

| Spend Band | 1-Channel Monthly | 6-Month Prepay | Multi-Channel |
|---|---|---|---|
| Up to $10k | $1,250 | $1,000 | $2,500+ |
| $10k-$25k | $1,750 | $1,400 | $3,000+ |
| $25k-$50k | $2,250 | $1,800 | $3,500+ |
| $50k+ | $3,250 | $2,600 | $4,500+ |
Book a discovery call to move to a performance-based agency model centered on Net New ARR growth.

FAQ
What is the CPL formula for agencies?
Cost Per Lead equals Total Marketing Spend divided by Total Leads generated. For B2B SaaS, the average CPL is $237, although high-performing agencies often reach 30-50% below that benchmark with targeted campaigns and negative keyword refinement. Track CPL by channel, campaign, and keyword to uncover specific improvement opportunities.
How should agencies choose between HubSpot and Salesforce?
HubSpot usually fits SMB agencies that want integrated marketing automation, built-in attribution, and faster setup. Salesforce suits enterprises that need deep customization, advanced pipeline management, and complex attribution models. Match the platform to client size, internal resources, and reporting complexity.
What belongs in an agency performance dashboard?
Effective dashboards include real-time SQL tracking, Net New ARR attribution, channel-level ROAS, pipeline velocity, and CAC payback. Connect ad spend to closed revenue with GCLID tracking and CRM integration. This structure gives clients a complete view of ROI from first click to signed contract.
How do agencies attribute ARR in long B2B sales cycles?
Multi-touch attribution models track every touchpoint from first click through closed deal using GCLID parameters, CRM data, and first-party tracking. Advanced agencies use tools like Factors.ai for AI-powered attribution that accounts for dark funnel activity and cross-channel influence. This approach produces more accurate ARR credit across campaigns.
Which 2026 AI tools improve agency reporting?
New AI tools focus on predictive attribution, automated insights, and real-time optimization suggestions. Factors.ai offers AI-powered revenue attribution, while platforms like Cometly support server-side tracking and conversion sync. These tools help agencies handle privacy changes while keeping revenue reporting accurate.
Conclusion
The five most critical metrics for performance-based agencies in 2026 are Cost Per Lead, SQL Rate, Net New ARR, CAC Payback, and Channel ROAS. Together they create a clear framework for transparent reporting that proves marketing ROI and supports performance-based retainers.
Bootstrap agencies can start with CPL and SQL Rate improvements, while scaling agencies should add full ARR tracking and multi-touch attribution. The tools and benchmarks in this guide help agencies build reporting that clients trust for long-term partnerships.
Book a discovery call with SaaSHero for a full audit of your reporting and a shift toward revenue-focused performance tracking.