




Written by: Aaron Rovner, Founder, Saas Hero | Last updated: August 29, 2026
Key Takeaways
- Bootstrapped B2B SaaS founders protect runway by judging every marketing platform on total cost of ownership, time to value, and attribution depth.
- Any platform that scores below 3 on attribution depth fails for teams that report pipeline to investors or a board.
- Sticker prices usually represent only 6–12% of true TCO, while hidden multipliers like founder-time cost and the action gap can reach 4×–18× the listed subscription.
- At the $0–50k MRR band, platforms that need more than 14 days to deliver a first actionable insight create unacceptable runway risk.
- Compare your current stack against SaaSHero’s flat retainer and schedule a stack audit call to see where your runway is leaking.
The Three Criteria That Protect Your Runway
Bootstrapped founders often compare tools on sticker price and feature lists, which hides the real economic impact of each platform. A simple framework built on three criteria gives you a clearer view of how every tool affects cash, time, and revenue. That framework uses total cost of ownership, time to value, and attribution depth as the core filters.
TCO measures the complete cash and calendar cost of a platform over its useful life, not just the subscription line item. TTV measures how many days pass before the platform produces a result you can act on. Attribution depth measures whether the platform connects ad spend to closed revenue through native CRM events or stops at form fills. A platform that scores poorly on any one of these three criteria will consume runway faster than it generates pipeline.
15-Minute Revenue-First Scoring System You Can Apply Today
Once you understand the three criteria, you need a fast way to score each platform in your stack against them. The scoring system below turns TCO, TTV, and attribution depth into concrete numbers you can fill in within 15 minutes per platform. Use it to compare tools side by side and decide which ones stay, which ones go, and which ones never enter the stack.
Before you start scoring, download the 2026-updated comparison spreadsheet and populate it with your own figures. The sheet includes verified pricing and founder-time estimates for common tools, so you can benchmark your numbers against real-world data.
Request the pre-filled 2026 comparison spreadsheet with verified pricing, founder-time estimates, and attribution scores for the platforms most common in bootstrapped B2B SaaS stacks.
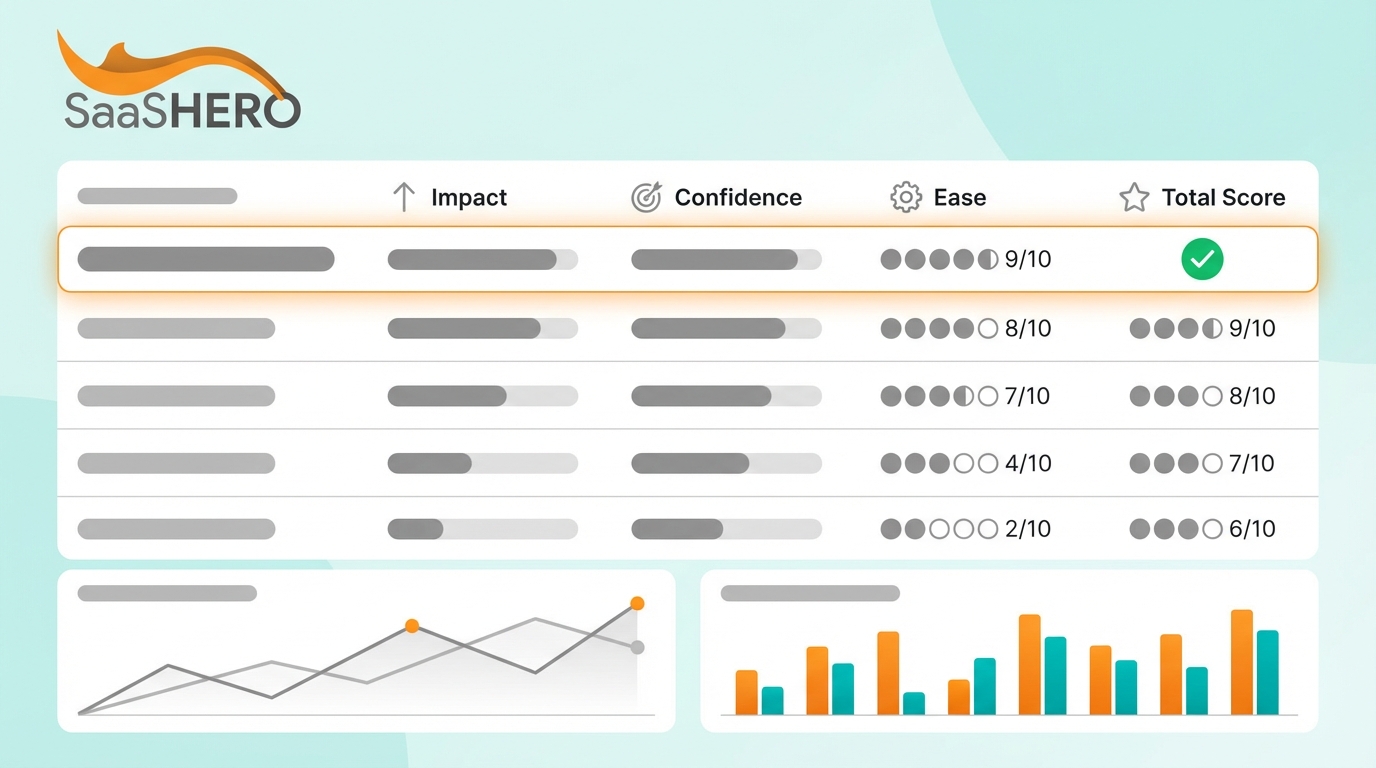
The three columns in the scoring matrix work together to capture the three criteria in comparable form. The first column, 2026 flat-tier price, records the annual subscription cost for the plan tier a lean team will actually use, not the entry-level plan used in vendor marketing. That sticker price feeds into the second column, founder-time cost (hours/month), which tracks the monthly hours a founder or solo marketer must invest to operate the platform, multiplied by an imputed hourly rate of $150 to create a cash-equivalent cost. The third column, CRM-revenue attribution score (1–5), translates attribution depth into a simple scale where 1 means form-fill only with no CRM connection, 3 means native CRM integration with lifecycle stage tracking, and 5 means full-chain ownership from paid media through closed-won revenue with bidirectional sync.
- 2026 flat-tier price: The annual subscription cost for the plan tier a lean team actually needs, not the entry-level plan used in vendor marketing.
- Founder-time cost (hours/month): The monthly hours a founder or solo marketer must invest to operate the platform, multiplied by an imputed hourly rate of $150 to produce a cash-equivalent cost.
- CRM-revenue attribution score (1–5): 1 = form-fill only, no CRM connection; 3 = native CRM integration with lifecycle stage tracking; 5 = full-chain ownership from paid media through closed-won revenue with bidirectional sync.
To score a platform, fill in all three columns, then apply the filters in sequence. First, if the attribution score is below 3 and you report pipeline to investors or a board, disqualify the platform regardless of its TCO or TTV. Second, calculate true TCO by adding the subscription fee to the annualized founder-time cost, which equals monthly hours multiplied by $150 and then multiplied by 12. Third, compare the platform’s TTV against the threshold for your MRR band and disqualify any tool that exceeds that limit. Any platform that survives all three filters belongs on your shortlist for deeper evaluation.
Any platform scoring below 3 on attribution depth is disqualified for founders who must report pipeline to a board or investor, regardless of its TCO or TTV performance.
TCO Comparison: How Hidden Multipliers Distort Pricing
Sticker price is the least informative number in any platform comparison. A 2026 analysis of seven common B2B marketing tools found that true TCO ranges from 8× to 18× the listed annual subscription price for a 3–5 person team, with the subscription fee itself representing only 6–12% of total cost. The six TCO layers that create this multiplier are sticker price, implementation labor, learning-curve hours, annual maintenance burden, integration overhead, and the action gap, which is the revenue value of tool-generated recommendations a lean team lacks bandwidth to execute.
The action gap alone accounts for 40–70% of true TCO across common marketing tools, and Gartner’s 2023 CMO Spend and Strategy Survey found that marketing leaders utilize only 33% of their martech stack’s capabilities on average. Even under conservative assumptions, the TCO multiplier for marketing tools never drops below 4× for lean B2B teams. The table below shows how that pattern appears across common platform categories and highlights how often the sticker price is the smallest number in the row.
| Platform category | 2026 sticker price (annual) | True TCO range (annual) | TCO multiplier |
|---|---|---|---|
| SEO / keyword research (e.g., Ahrefs Standard) | $2,490 | typically $2,388–$6,000+ depending on team size and seats | 2×–3× depending on team size |
| Marketing automation (e.g., HubSpot Marketing Hub Pro) | $9,600 | typically $15K–$25K for small teams (5 users, 2K contacts) plus $3K onboarding and contact-tier overages | 5×–9.9× |
| Experimentation (e.g., Optimizely Web) | $36,000+ | $72K–$140K | 2×–3.9× |
| Paid ads management (e.g., Google Ads platform fee) | $0 | $15K–$35K management TCO | Not applicable, cost is entirely operational |
Use this pattern to reality-check any platform comparison that focuses only on subscription fees. Percentage-of-spend and contact-based pricing models add a compounding variable that makes TCO impossible to forecast at the $0–50k MRR band. Percentage-of-spend pricing models cause platform costs to rise automatically as campaigns scale, increasing variable exposure in TCO. Contact-based email platforms follow the same pattern: Mailchimp’s 2026 Standard plan reaches approximately $75/month at 5,000 subscribers and $110/month at 10,000 subscribers, while flat-rate alternatives like Flodesk retired its flat-rate $38/month unlimited-subscribers plan for new members on December 2, 2025; new users pay subscriber-based pricing starting at $25/month (Lite) or $28/month (Pro) for up to 1,000 active subscribers. Both percentage-of-spend and contact-based models are disqualified for the $0–50k MRR band on TCO grounds alone.
TTV Comparison: When First Value Arrives for Each MRR Band
TCO tells you what a platform costs over its lifetime, but it does not tell you when you will see the first dollar of return. Time to value becomes the second filter, because long implementations quietly burn runway before you can make a single optimization decision. According to SPI Research’s 2025 Professional Services Maturity Benchmark, the median B2B SaaS implementation takes 60 to 90 days to reach first value, while top-performing teams deliver first value in 30 to 45 days. For a founder with nine months of runway, a 90-day implementation window consumes one-third of available time before a single optimization decision can be made.
MRR-band TTV thresholds for disqualification:
- $0–50k MRR: Any platform requiring more than 14 days to first actionable insight is disqualified. At this band, SMB and simple implementations should target 14 to 30 days, and anything above 30 days is a runway risk.
- $50–200k MRR: Platforms with 30–45 day TTV are acceptable if attribution depth scores 4 or 5. Enterprise-complexity tools requiring 90 to 180 days are disqualified unless the team has dedicated RevOps capacity.
- $200k+ MRR: Full-stack platforms with 60–90 day TTV become viable when the team has internal marketing operations support and a defined CRM owner.
For a straightforward business with a single website and standard ad platforms, basic conversion tracking can typically be configured in under an hour and verified within 24-48 hours. Landing page and waitlist products reach first deploy in 1.2 weeks on average, which makes purpose-built landing page tools the fastest-TTV category in the stack.
Attribution Depth Comparison: Connecting Spend to Revenue
Attribution depth is the criterion most platforms fail without warning. A platform that reports cost per lead without connecting those leads to closed-won revenue trains the ad algorithm toward the wrong audience. In a worked example of two $20,000 paid search campaigns, Campaign A produced 200 leads and $60,000 closed-won revenue while Campaign B produced 120 leads and $120,000 closed-won revenue, and optimizing only to lead volume selects the lower-value campaign.
The 1–5 attribution depth scoring rubric:
- Score 1: Form-fill tracking only. No CRM connection. Ad platform optimizes toward whoever submits forms.
- Score 2: CRM contact sync with lead source field. No lifecycle stage tracking or deal value connection.
- Score 3: Native CRM integration with MQL/SQL stage mapping. Deal create attribution available. No closed-won revenue sync.
- Score 4: Closed-won revenue connected to touchpoints via native CRM integration. HubSpot Marketing Hub Enterprise provides contact create, deal create, and revenue attribution reports natively, which qualifies at this level.
- Score 5: Full-chain ownership from paid media through closed-won revenue with bidirectional sync, lifecycle stage events pushed back to ad platforms for optimization, and a single team accountable for the entire path. Deep attribution depth exists when any closed-won deal record can be traced back through every marketing and sales touchpoint using only CRM events, without external tracking gaps.
A score of 5 requires that one party owns the ad account, the landing page, the conversion tracking configuration, and the CRM reporting layer at the same time. No self-serve platform achieves a 5 by itself, because that level of depth requires an operating team that controls the full chain.
MRR-Banded Platform Shortlists You Can Compare Against
The three tables below apply the TCO, TTV, and attribution filters to common platforms at each MRR band. Use your current MRR to find the right band, then compare your active platforms against the shortlist. Any platform you use today that does not appear in your band’s table is likely consuming runway faster than it generates pipeline.

Pay close attention to the attribution score column as you review the tables. If you report pipeline to investors or a board and your current platform scores below 3, you are steering ad spend toward the wrong audience, even if lead volume looks healthy.
$0–50k MRR — Surviving platforms
| Platform / approach | 2026 flat-tier price | Founder-time (hrs/month) | Attribution score |
|---|---|---|---|
| Google Ads (self-managed) + GTM | $0 platform fee | 20–40 hrs (management TCO $15K–$35K/yr) | 2 (form-fill default; CRM sync requires manual setup) |
| Flat-rate email (e.g., Flodesk) | starting at $300/yr | 4–8 hrs | 1–2 (no native CRM revenue attribution) |
| Lightweight attribution (e.g., AttributeIQ Starter) | ~£852/yr (~$1,080) | 2–5 hrs | 3 (GA4 + HubSpot integration live within 24 hours) |
$50–200k MRR — Surviving platforms
| Platform / approach | 2026 flat-tier price | Founder-time (hrs/month) | Attribution score |
|---|---|---|---|
| HubSpot Marketing Hub Pro | $9,600/yr | 15–25 hrs (true TCO typically $15K–$25K for small teams (5 users, 2K contacts) plus $3K onboarding and contact-tier overages) | 3–4 |
| Mid-market attribution (e.g., Dreamdata Essentials) | £15,000–£50,000/yr | 10–20 hrs | 4 |
| SaaSHero (outsourced growth team) | Flat retainer from $4,000/month, indexed to ad spend | 2–4 hrs (approval and strategy calls only) | 5 |
$200k+ MRR — Surviving platforms
| Platform / approach | 2026 flat-tier price | Founder-time (hrs/month) | Attribution score |
|---|---|---|---|
| HubSpot Marketing Hub Enterprise | $43,200/yr | 10–15 hrs (requires RevOps owner) | 4 |
| Enterprise attribution (e.g., Bizible / HockeyStack) | £50,000–£150,000+/yr | 20–40 hrs (dedicated admin) | 4–5 |
| SaaSHero (outsourced growth team) | Flat retainer indexed to ad spend, with no per-channel fees | 2–4 hrs | 5 |
Founder-Time Cost Column: The Hidden Runway Killer
Founder time is the one input that cannot be replenished, which makes it the most expensive line item in any TCO calculation. At an imputed rate of $150/hour, 20 hours per month managing a self-serve paid ads platform costs $3,000 in opportunity cost, and that figure applies before a single ad is optimized or a single insight is acted on. As shown in the TCO comparison earlier, the subscription fee represents only 6–12% of total cost, and the remaining 88–94% is operational overhead where founder time is often the largest component.
The reason founder-time cost runs so high is that most of it is operational, not strategic. BCG states that 30% of the measurement battle is assembling the right KPIs and toolkit, while 70% is getting the people and processes in place to enable those KPIs to drive decisions. That 70% operational load is what drives the founder-time column in the scoring matrix.
SaaSHero’s flat retainer indexed to total monthly ad spend removes the founder-time column from the scoring matrix entirely. The team owns strategy, execution, creative, landing pages, and CRM-connected reporting. The founder’s time input is limited to the bi-weekly strategy call and the approval gate, which usually totals two to four hours per month.

Get a founder-time cost analysis comparing your current overhead against SaaSHero’s flat retainer.
10-Minute Implementation Checklist and Quarterly Refresh
Founders avoid expensive implementation mistakes by running a simple checklist before adding any platform to the stack. Treat this list as a gate: if any item cannot be confirmed, the platform fails and does not enter your environment.
- Confirm the 2026 flat-tier price for the plan tier the team will actually use, not the entry plan.
- Identify the implementation owner. If no named internal person can own setup, add 15–40 hours of founder time to the TCO calculation.
- Verify that native CRM integration exists and is documented. Test it by submitting a lead and confirming that campaign source, UTM parameters, and timestamp appear in the CRM record automatically.
- Confirm TTV against the MRR-band threshold. If the vendor cannot provide a documented median TTV, treat it as 90 days.
- Score attribution depth using the 1–5 rubric. Disqualify any platform scoring below 3 if pipeline reporting is required.
- Calculate the action gap by estimating how many tool-generated recommendations the team will realistically execute per month, then multiplying unexecuted recommendations by their estimated revenue value.
Founders also keep their stack healthy by running a quarterly refresh process. This process revalidates pricing, time cost, and attribution depth so that silent drift does not erode runway.
- Re-score every active platform against current 2026 pricing, because vendor pricing changes frequently and mid-tier plans are commonly restructured.
- Audit founder-time hours logged against each platform over the prior quarter. Any platform consuming more than 10 hours per month without a 5 attribution score becomes a disqualification candidate.
- Test attribution depth by advancing a test lead through CRM pipeline stages and verifying that the attribution platform shows the full journey with revenue properly attributed across touchpoints.
- Compare closed-won revenue in the CRM against attribution-reported revenue. A variance above 5% indicates data loss during sync and requires immediate investigation.
Why SaaSHero Survives Every Filter in This Framework
No self-serve marketing platform scores a 5 on attribution depth, because a score of 5 requires one team to own the paid media account, the landing page, the conversion tracking configuration, and the CRM reporting layer at the same time. Self-serve tools provide components, but they do not own the chain between them.
SaaSHero operates as an outsourced inbound growth team that owns the full chain. The team manages paid media strategy and execution across Google Ads, Microsoft Ads, LinkedIn, Meta, Reddit, and TikTok. It also handles creative from concept through copy and design, landing page design, build, hosting, and A/B testing, plus attribution and reporting connected directly to the client’s CRM. The retainer is flat and indexed to total monthly ad spend, not to channel count. Adding a channel, shifting budget between channels, or closing a channel that is not returning leaves the fee unchanged, which removes the per-channel fee trap that locks budget into underperforming channels at competing agencies.

For a bootstrapped founder with nine months of runway, the relevant comparison is not SaaSHero’s retainer against a single platform subscription. The real comparison is SaaSHero’s retainer against the sum of platform subscriptions, founder-time cost, integration overhead, action gap cost, and the attribution gap that turns every budget decision into a guess. On that comparison, SaaSHero is the only option that scores a 5 on attribution depth, sub-30-day TTV for campaign launch, and a founder-time cost of two to four hours per month.

Frequently Asked Questions
What components should a bootstrapped B2B SaaS founder include in a TCO calculation for a marketing platform?
A complete TCO calculation for a marketing platform includes six components beyond the subscription fee. These components are implementation labor, which covers the one-time hours required to configure the platform multiplied by the team’s blended hourly rate, and learning-curve cost, which covers hours to reach proficiency for each team member who will use the tool. Annual maintenance burden captures the monthly hours required to keep the platform configured correctly, multiplied by 12, while integration overhead covers middleware subscriptions plus the engineering hours required when integrations break or need updating. The action gap measures the revenue value of tool-generated recommendations the team lacks bandwidth to execute, and switching cost captures the data migration and retraining cost when the platform is eventually replaced. For most lean B2B SaaS teams, the subscription fee represents only a small fraction of this total. The action gap is typically the largest single component, because most teams operate their martech stack at a fraction of its capability.
What is a realistic time-to-value benchmark for marketing tools at the $0–50k MRR band?
At the $0–50k MRR band, a marketing platform must deliver a first actionable insight within 14 days to avoid consuming a disproportionate share of a nine-month runway. For paid ads platforms with clean Google Tag Manager access and no significant technical debt, conversion tracking setup matches the benchmark mentioned earlier, with configuration in under an hour and verification within 24-48 hours. Landing page tools purpose-built for campaign use reach first deploy in approximately one to two weeks. Attribution platforms with native HubSpot or GA4 integrations, such as lightweight options in the AttributeIQ category, can be live within 24 hours for the integration layer. Enterprise-complexity platforms with 60–90 day implementation timelines remain structurally incompatible with the $0–50k MRR band regardless of their feature set, because the implementation window consumes runway before any optimization data is available.
How do you test whether a marketing platform has genuine CRM-revenue attribution depth before committing to a contract?
The most reliable pre-contract test is a structured end-to-end attribution validation. Submit a test lead through a live campaign, then advance that lead through the CRM pipeline stages from lead creation through MQL, SQL, opportunity, and a test closed-won record with a defined revenue amount. Open the attribution platform and verify that the full journey appears with the correct revenue amount attributed across touchpoints. If the platform cannot show the closed-won revenue amount connected to the original campaign source, it does not have genuine CRM-revenue attribution depth.
A secondary test compares the attribution platform’s reported revenue against actual closed-won revenue in the CRM over a 60–90 day window. A variance above 5% indicates data loss during sync and disqualifies the platform for revenue-based optimization. Platforms that stop at contact creation or MQL stage without connecting to closed-won deal value score no higher than a 3 on the attribution depth rubric, regardless of their marketing claims.
Run Your Own Scoring Matrix Against SaaSHero
Founders can apply the 15-minute scoring system to their current stack and see the tradeoffs in clear numbers. Start by calculating the true TCO of every active platform using the six-component framework, then measure your actual founder-time hours against each tool over the last 90 days, and score each platform’s attribution depth against the 1–5 rubric. Compare the total against SaaSHero’s flat retainer, which covers one team, one fee, all channels, and attribution connected to closed-won revenue in your CRM.
Founders who complete this exercise consistently find that the sum of their current platform costs, founder-time overhead, and attribution gaps exceeds the cost of replacing the entire stack with a single accountable team. Book a revenue-focused stack review and bring your current stack, and the SaaSHero team will run the scoring matrix with you and show you exactly where your runway is leaking.