

Key Takeaways for Revenue-First B2B SaaS Growth
- B2B SaaS median CAC has risen 180% with payback periods extending 150%, so you now need campaign-level unit economics tracking from ad click to Net New ARR.
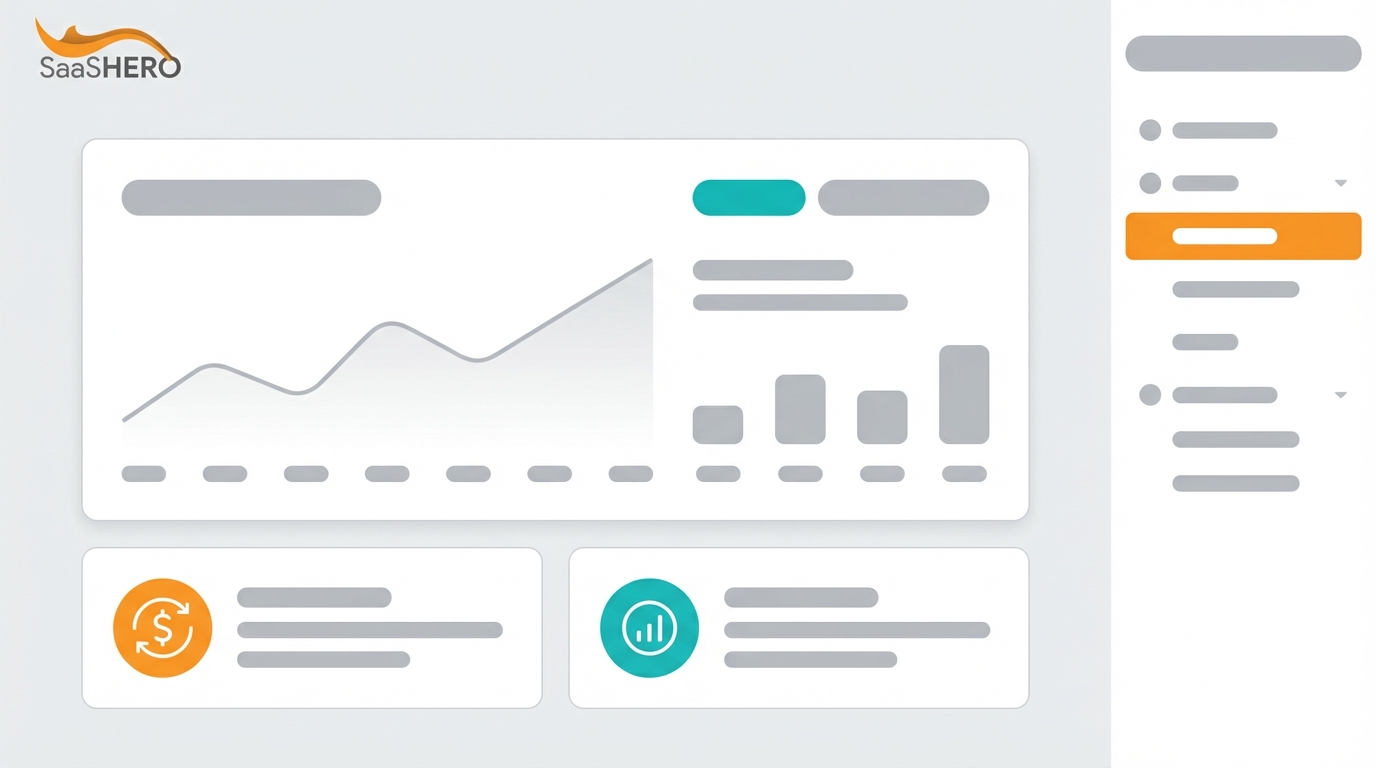
- Use a 5-step Revenue-First Framework: calculate baselines, track revenue attribution, set thresholds, improve performance with conquesting, and review weekly ARR dashboards.
- Target LTV:CAC ratios of 3:1 for solid performance and 5:1 or higher for strong growth, with payback periods under 12 months and ideally under 100 days.
- Run intent-based competitor conquesting on pricing, alternatives, and reviews, supported by dedicated landing pages and negative keywords to improve efficiency.
- Audit your unit economics and accelerate profitable growth by booking a discovery call with SaaSHero.
Core Requirements Before You Implement This Framework
Set up your core infrastructure first with a CRM system like HubSpot or Salesforce, advertising platforms such as Google Ads and LinkedIn, and analytics tools like Looker Studio. You also need a clear handle on key formulas: LTV = (ARPA × Gross Margin) / Churn Rate, and CAC as the total acquisition cost that includes ad spend, sales, and marketing overhead.
B2B SaaS introduces extra complexity with dark funnel attribution, multi-tier pricing models, and long sales cycles. Most teams need 2 to 4 weeks to configure accurate tracking. The main risk comes from attribution gaps between ad clicks and closed revenue, which advanced CRM integrations help close.
Five-Part Revenue-First Framework Overview
The Revenue-First Framework uses five sequential steps to improve unit economics at the campaign level.
- Calculate Baselines: Establish LTV:CAC ratios by pricing tier and acquisition channel.
- Implement Revenue Tracking: Connect GCLID parameters to your CRM for complete attribution.
- Set Campaign Thresholds: Define bid caps based on payback period targets.
- Improve Results with Conquesting: Deploy intent-based competitor campaigns.
- Review and Scale: Monitor weekly ARR dashboards to validate performance.
Current 2026 benchmarks give you clear performance targets.

|
Metric |
Good |
Great |
LinkedIn Benchmark |
Google Ads Benchmark |
|
LTV:CAC Ratio |
3:1 |
5:1+ |
113% ROAS |
78% ROAS |
|
Payback Period |
<12 months |
<100 days |
90 days |
120 days |
|
Cost Per Lead |
$150-250 |
$100-150 |
$60-150 |
~$237 |
Step-by-Step Revenue-First Implementation
Step 1: Calculate Baseline Unit Economics by Tier and Channel
Start by segmenting your customer base across pricing tiers and acquisition channels. Most effective tier structures use 3 to 4 pricing levels that match clear customer segments and usage patterns.
Calculate LTV:CAC ratios for each segment with this formula: LTV:CAC = (ARPA × Gross Margin × (1 / Churn Rate)) / Total Acquisition Cost. An HR Tech SaaS might find that its Enterprise tier from LinkedIn delivers a 5:1 LTV:CAC, while its Starter tier from Google Ads only reaches 2:1, which reveals clear channel and tier improvement opportunities.
Step 2: Build Revenue Tracking Infrastructure
Set up complete attribution by connecting ad clicks to closed revenue with GCLID and UTM parameter tracking. Integrate marketing automation tools like HubSpot or Marketo to track lead source performance and maintain accurate attribution data across the full customer journey.
Configure your CRM to capture first-touch, last-touch, and multi-touch attribution models. Last-click attribution often undervalues top-of-funnel awareness, while multi-touch models provide more accurate revenue attribution for complex B2B sales cycles.
Step 3: Set Campaign-Level Payback Thresholds
Define clear performance thresholds that align with your target payback periods. Pause keywords or audiences that repeatedly exceed a 120-day payback period unless they show strong pipeline quality signals.
Aim for payback periods of 12 to 18 months at the upper limit, with your strongest campaigns recovering spend in under 100 days.
Common Mistake: Many teams confuse CPA, which measures operational cost per acquisition, with CAC, which includes the full customer acquisition cost, such as sales overhead. CPA reflects campaign efficiency, while CAC reflects complete unit economics that include sales team costs and onboarding.
Traditional agencies often chase volume instead of efficiency because percentage-based fees reward higher spend regardless of payback periods. Choose revenue-aligned partners who focus on your unit economics instead of their fee growth. Book a discovery call to explore flat-fee retainers that align agency incentives with your profitability targets.

Step 4: Run Competitor Conquesting on High-Intent Searches
Launch intent-based competitor campaigns that reach users who actively evaluate alternatives. Focus on three intent categories: pricing research with queries like competitor plus pricing, problem or complaint searches with competitor plus alternatives, and validation searches with competitor plus reviews.
Create dedicated landing pages for each intent type instead of sending traffic to a generic home page. A user who searches for “Salesforce pricing” needs different messaging than someone who searches for “Salesforce alternatives.” Build comparison tables, switching incentives, and social proof tailored to each competitor and intent signal.

Use negative keyword strategies to cut wasted spend on navigational queries. Users who search only a competitor brand name usually want a login page, not a replacement.
Step 5: Run Weekly Revenue and Pipeline Reviews
Set up automated dashboards that track Net New ARR, pipeline velocity, and channel-level unit economics. Build real-time dashboards in your CRM to monitor pipeline health and time from first contact to close so you can judge performance accurately.
Review leading indicators such as recent activity on deals, follow-up cadence, and stage progression speed. These signals highlight campaigns that need attention before they drag down monthly ARR targets.
How to Measure and Validate Revenue-First Success
Track success by hitting sub-100-day payback periods, keeping LTV:CAC ratios at 3:1 or higher, and showing clear Net New ARR lift from performance marketing channels. CLTV:CAC ratios of 3:1 or better support sustainable growth, while payback periods under 12 months protect cash flow.
Close attribution gaps and lead quality issues with SQL tracking that connects marketing touchpoints to closed revenue. This approach requires deeper CRM integration that goes beyond basic conversion tracking.
Advanced Strategies to Improve Unit Economics
Use multi-tier LTV segmentation so campaigns focus on lifetime value instead of only the first transaction. Analyze customer data such as usage patterns and feature adoption to guide tier-specific targeting that improves long-term unit economics.
Expand conquesting to intent-rich surfaces like pricing comparison pages, review sites, and complaint forums. Connect with platforms such as Capterra and G2 to gather competitive intelligence and uncover new targeting options.
Summary and Next Steps for Your Team
The Revenue-First Framework turns performance marketing into a profit driver by improving unit economics in a structured way. Start by auditing your current CAC and payback metrics across each channel, then roll out tracking infrastructure that gives you full attribution visibility.
Focus on revenue outcomes instead of vanity metrics such as impressions or clicks. Book a discovery call to apply this framework with expert support and speed up your path to profitable growth.

Frequently Asked Questions
How should I handle unit economics calculations for multiple pricing tiers?
Segment your analysis by Annual Contract Value and track each tier’s LTV:CAC ratio separately. Different tiers attract different customer profiles with unique usage patterns, churn rates, and expansion potential. Build separate baselines for each tier, then tune campaigns to attract more customers into higher-value segments.
Track upsell and cross-sell revenue so you capture full lifetime value across tier upgrades. Most successful SaaS companies find that 3 to 4 tiers give enough choice without causing decision fatigue.
What is the difference between LTV:CAC and ROAS for SaaS performance marketing?
LTV:CAC measures long-term customer profitability by comparing total lifetime value to acquisition costs, which suits subscription businesses with long relationships. ROAS, or Return on Ad Spend, shows short-term campaign efficiency, usually over 30 to 90 days.
For B2B SaaS with longer sales cycles, LTV:CAC gives better guidance for budget allocation. ROAS still helps with tactical campaign tuning and quick performance checks. Healthy ROAS benchmarks usually range from 200 to 400 percent, depending on gross margins and sales cycle length.
What are typical payback periods by acquisition channel in 2026?
LinkedIn advertising often reaches 90-day payback periods for B2B SaaS because of strong targeting and professional context. Google Ads usually sit closer to 120-day payback periods due to broader audiences and higher competition.
These benchmarks reflect a market where acquisition costs have climbed sharply. Top performers reach payback in under 80 days through precise targeting, strong offers, and refined conversion funnels. Prioritize channels by payback efficiency instead of volume, especially when capital is tight.
How do I track attribution from an ad click to closed revenue?
Use GCLID and UTM parameter tracking to connect ad clicks with CRM records. Configure your marketing automation platform to capture and pass these parameters through forms and landing page interactions. Set up multi-touch attribution models in your CRM so you can credit several touchpoints across the buyer journey.
Use tools such as HubSpot attribution reporting or Salesforce campaign influence tracking to see the full path from first ad exposure to closed-won revenue. Maintain strong data hygiene and regular validation to keep attribution accurate in complex B2B sales cycles.
When should I scale successful campaigns versus testing new channels?
Scale existing campaigns once they hit target unit economics for 2 to 4 straight weeks. Increase budgets in 20 to 30 percent steps and watch for performance drops. Test new channels when current ones start to saturate or when you need audience diversity.
Keep 70 to 80 percent of the budget in proven channels and 20 to 30 percent in tests. Hold new channels to strict performance thresholds and require viable unit economics before you shift major budget. This balance supports sustainable growth while you expand your acquisition mix.