

Key Takeaways
- B2B SaaS agencies should move from vanity metrics to revenue-first ARR reporting, tracking Net New ARR as New + Expansion – Churn – Contraction to prove marketing ROI.
- Agencies should implement GCLID-to-CRM tracking and Looker Studio dashboards to connect ad spend directly to closed revenue.
- Target benchmarks like NRR above 110-130%, Rule of 40 or 65 scores, and CAC payback under 80 days to frame client performance.
- Set weekly Slack updates, bi-weekly calls, and monthly ARR analysis with ROI-focused narratives to build trust and retention.
- Book a discovery call with SaaSHero to deploy this playbook and replicate results like $504k Net New ARR for TripMaster.

Tools and Context for Revenue-First ARR Reporting
Effective ARR reporting starts with the right tools and a clear baseline. Core platforms include Looker Studio for visualization, HubSpot or Salesforce for CRM integration, and Google Analytics for attribution tracking. Agencies need client CRM access and the ability to track across multiple ad accounts. The basic ARR calculation is MRR × 12, and agencies should break this into Net New ARR components: new customer revenue, expansion revenue from upgrades, and revenue lost to churn or contraction. 2026 capital efficiency trends emphasize Rule of 65 focus and Net New ARR as the north star metric. Initial setup usually takes 2-4 hours, followed by weekly 30-minute review sessions to keep reporting accurate and useful.
8-Step Framework for ARR Reporting
The 8-step ARR reporting process gives agencies a repeatable way to align reporting with revenue outcomes.
| Step | Description | Key Output |
|---|---|---|
| 1 | Define Net New ARR components | Component tracking framework |
| 2 | Integrate tracking systems | GCLID-to-CRM attribution |
| 3 | Build ARR breakdowns | New, expansion, churn analysis |
| 4 | Create visual dashboards | Client-facing ARR reports |
| 5 | Layer performance KPIs | NRR, CAC:LTV, Rule of 40 |
| 6 | Craft client narrative | ROI-focused storytelling |
| 7 | Set reporting cadence | Weekly and monthly rhythms |
| 8 | Forecast and iterate | Predictive ARR modeling |
The core ARR formula agencies should track is: Net ARR = New + Expansion – Churn – Contraction. This framework mirrors SaaSHero’s methodology that produced $504k Net New ARR for TripMaster through disciplined revenue attribution.

Step-by-Step Instructions
Step 1: Define and Calculate ARR Components
Start by locking in clear definitions for each ARR component. ARR includes base recurring revenue plus expansion revenue minus churn revenue. New ARR covers annualized revenue from newly acquired customers during the reporting period. Expansion ARR captures additional revenue from existing customers through upgrades, add-ons, or higher usage. Churn ARR tracks revenue lost when customers cancel, and contraction ARR measures revenue decreases from downgrades.
| Component | Definition | Calculation Method |
|---|---|---|
| New ARR | Revenue from new customers | Monthly subscription × 12 |
| Expansion ARR | Upsells and add-ons | Upgrade value × 12 |
| Churn ARR | Lost customer revenue | Cancelled MRR × 12 |
| Contraction ARR | Downgrade revenue loss | Reduction amount × 12 |
Step 2: Connect GCLID Data to the CRM
Agencies should connect ad clicks to closed revenue with GCLID-to-CRM tracking. Capture the Google Click ID on landing pages and pass it through forms into the CRM. This setup creates a clear path from first ad impression through the full sales cycle. Configure HubSpot or Salesforce to store UTM parameters and GCLID values for every lead. SaaSHero’s integration approach allows every dollar of ad spend to be traced to specific ARR outcomes.
Step 3: Build Cohort Views and NRR Analysis
Cohort charts reveal how customer value changes over time. Target Net Revenue Retention (NRR) above 110%, with best-in-class companies reaching 120-130%. Track monthly cohorts to spot patterns in retention and expansion. Use this analysis to see which channels and campaigns bring in customers who stay longer and expand more.
Step 4: Build Client-Facing Performance Dashboards
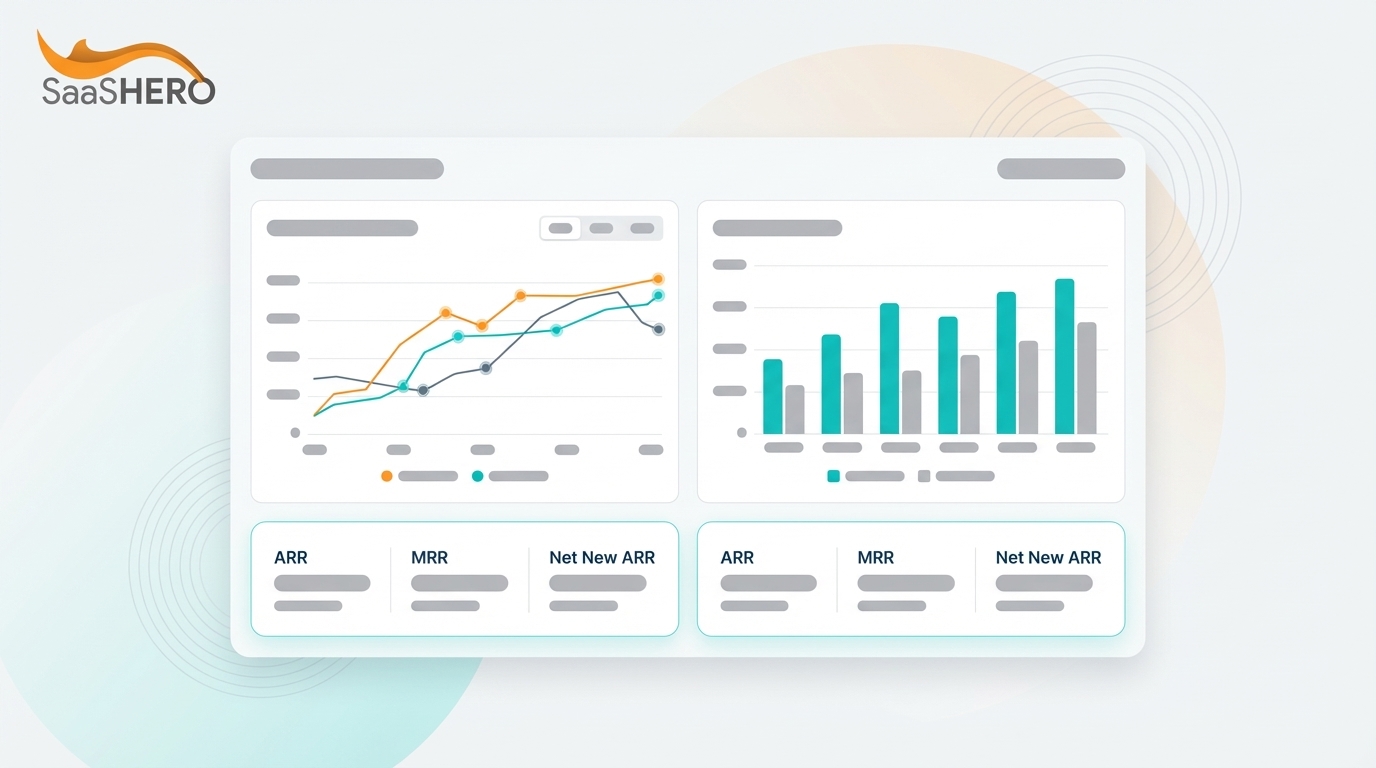
Looker Studio dashboards should highlight pipeline value and ARR against ad spend. Include real-time ARR tracking, campaign performance by revenue, and cost per ARR dollar acquired. Design client views that prioritize revenue metrics instead of impressions or clicks. Embed these dashboards in client communication channels so stakeholders can check performance at any time.
Step 5: Add Benchmark KPIs for Context
Benchmarks help clients understand whether performance is strong or weak. Target NRR of 110-130% and Rule of 40 scores above 40% for healthy SaaS growth. Track Customer Acquisition Cost payback and aim for 80 days or less, as in SaaSHero’s TestGorilla case study.
| Metric | Good Performance | Best-in-Class |
|---|---|---|
| NRR | 110-120% | 120-130% |
| ARR Growth | 20-40% YoY | 50%+ YoY |
| Rule of 40 | >40% | >65% |
| CAC Payback | <12 months | <6 months |
Step 6: Tell a Revenue Story Clients Remember
Reports should clearly connect marketing activity to revenue outcomes. Lead with statements like “Your $10k monthly ad spend generated $504k in Net New ARR” instead of click counts. Add specific customer examples and attribution paths that show how campaigns turned into revenue. This style of reporting builds trust and supports continued or increased marketing budgets.
Step 7: Set a Clear Reporting Rhythm
Consistent communication keeps everyone aligned on growth. Use weekly Slack updates for quick performance snapshots and bi-weekly calls for deeper strategy reviews. Establish weekly and monthly reporting rhythms for revenue attribution dashboards that cover both new customer ARR and expansion ARR. This structure reduces surprises and keeps focus on shared revenue targets.
Step 8: Forecast ARR and Improve Over Time
Forecasting turns ARR reporting into a planning tool. Build predictive models for ARR growth using current pipeline and historical conversion rates. Use scenario plans to show how different budget levels could affect future ARR. Continue to refine attribution rules and data quality. Book a discovery call to apply SaaSHero’s forecasting methods that have helped clients reach predictable, scalable growth.
How to Measure and Validate ARR Reporting Success
Clear success metrics keep ARR reporting accountable. Track client NRR above 115% and CAC payback under 80 days, as in SaaSHero’s TestGorilla case study. Measure dashboard usage and client satisfaction through regular feedback sessions. Benchmark against industry standards showing median ARR growth of 20-40% YoY for established SaaS companies. Close reporting gaps with better CRM integration and stronger attribution models. Monitor data completeness and accuracy so revenue reporting remains trustworthy.
Advanced ARR Reporting Options for Mature Agencies
Advanced teams can extend this framework for more sophisticated growth strategies. Scale-up implementations can include competitor conquest ARR tracking and Rule of 65 forecasting for capital-efficient growth. Mature agencies can add multi-touch attribution models and predictive churn analysis. Integrating product usage data supports more accurate expansion revenue forecasts. Book a discovery call to explore SaaSHero’s advanced ARR reporting solutions tailored to your agency and client mix.
Summary and Action Plan
Revenue-first ARR reporting shifts agencies from vendor status to strategic growth partner. This 8-step framework gives a clear path to show ROI and improve long-term retention. Start with ARR component definitions and tracking integration, then add dashboards, benchmarks, and forecasting. Consistent execution and ongoing refinement based on feedback and performance data keep the system effective.
FAQ
What constitutes good ARR growth for B2B SaaS agencies to report?
ARR growth targets depend on company stage and market conditions. Companies under $1M ARR often see median growth around 75%. Companies between $1M and $5M ARR should aim for about 40% growth. Established companies above $20M ARR typically reach 25-35% growth. Top-performing agencies help clients land in at least the 50th percentile for their revenue band, with standout cases reaching top quartile performance of 50% or more annual growth.
How should agencies apply Rule of 40 metrics in client ARR reports?
Rule of 40 blends growth rate and profit margin into one efficiency metric. Agencies should calculate it as (ARR Growth Rate % + EBITDA Margin %) ≥ 40%. In 2026, some investors push for Rule of 65 to reflect higher efficiency expectations. Agencies can show impact by tying their work to both faster growth and better unit economics, which directly improves the client’s Rule of 40 score and investor appeal.
What is the standard Net Revenue Retention formula for agency reporting?
Net Revenue Retention uses the formula (Starting ARR + Expansion ARR – Churn ARR – Contraction ARR) / Starting ARR × 100. NRR above 110% signals strong product-market fit and healthy expansion. Agencies should track NRR monthly and highlight trends in quarterly reviews. Reports should show how marketing contributes to both expansion and retention. Best-in-class SaaS companies reach NRR of 120-130%, which reflects significant expansion revenue from existing customers.
How frequently should agencies provide ARR updates to SaaS clients?
Most SaaS clients benefit from a structured reporting cadence. Weekly Slack updates should cover pipeline health and key leading indicators. Bi-weekly calls should review performance drivers and next steps. Monthly reports should include full ARR breakdowns, cohort analysis, and strategic recommendations. This rhythm keeps clients engaged and gives enough data for thoughtful decisions.
What tools are essential for accurate ARR attribution and reporting?
Accurate ARR attribution depends on a solid tool stack. Agencies should use a robust CRM such as HubSpot or Salesforce, Google Analytics for attribution tracking, and Looker Studio for visualization. Advanced setups also include GCLID capture, UTM tracking, and automated data pipelines between ad platforms and the CRM. Revenue attribution platforms like Cometly or HockeyStack support multi-touch attribution for complex B2B sales cycles. The priority is a complete data flow from first ad impression through closed-won revenue.