

Key Takeaways
- B2B SaaS companies need revenue-based reporting frameworks like 5 BEs, 8-Pillar, and W-Shaped attribution to connect ad spend directly to Net New ARR in 2026’s capital-constrained environment.
- Teams should target Rule of 40 compliance (>40%) and CAC:LTV >1:3 using benchmarks like 80-day CAC payback, NRR >130%, and faster pipeline velocity.
- CRM-integrated dashboards in HubSpot or Salesforce must power cohort analysis, revenue waterfalls, and GTM motion tracking, including ABM and competitor conquesting that can yield 650% ROI.
- Percentage-of-spend billing models create misaligned incentives, so B2B SaaS leaders should choose flat retainers tied to efficiency and outcomes such as $504k Net New ARR.
- SaaSHero provides proven templates, senior strategists, and revenue-first GTM execution, so you can schedule a discovery call and transform your operations today.
Revenue Reporting Frameworks That Tie Directly to ARR
Three primary frameworks dominate B2B SaaS revenue reporting in 2026, and each one fits a specific stage of growth. The 5 BEs Framework (Buyers, Behaviors, Budgets, Buying Process, Business Impact) builds customer intelligence for companies under $10M ARR. The 8-Pillar Framework extends this foundation with advanced attribution, cohort analysis, and pipeline velocity tracking for scale-ups. The W-Shaped Attribution Model captures the full buyer journey across multiple touchpoints, which is essential for complex enterprise sales cycles.
|
Framework |
Best For |
Key Metrics |
2026 Benchmarks |
|
5 BEs |
$5-15M ARR |
ICP Fit, Pipeline Velocity |
90-120 day cycles |
|
8-Pillar |
$15-50M ARR |
NRR, CAC Payback, Cohort LTV |
NRR >130%, 80-day payback |
|
W-Shaped |
Enterprise Sales |
Multi-touch Attribution, Deal Velocity |
24% faster revenue growth |
Two critical formulas guide 2026 performance. Pipeline Velocity equals (Leads × Win Rate × Average Deal Size) ÷ Sales Cycle. Net Revenue Retention equals (Starting MRR + Expansion – Churn – Contraction) ÷ Starting MRR. Top-quartile companies achieve NRR of 120%+ for PLG models, while best-in-class SaaS companies maintain NRR in the 130-150% range.
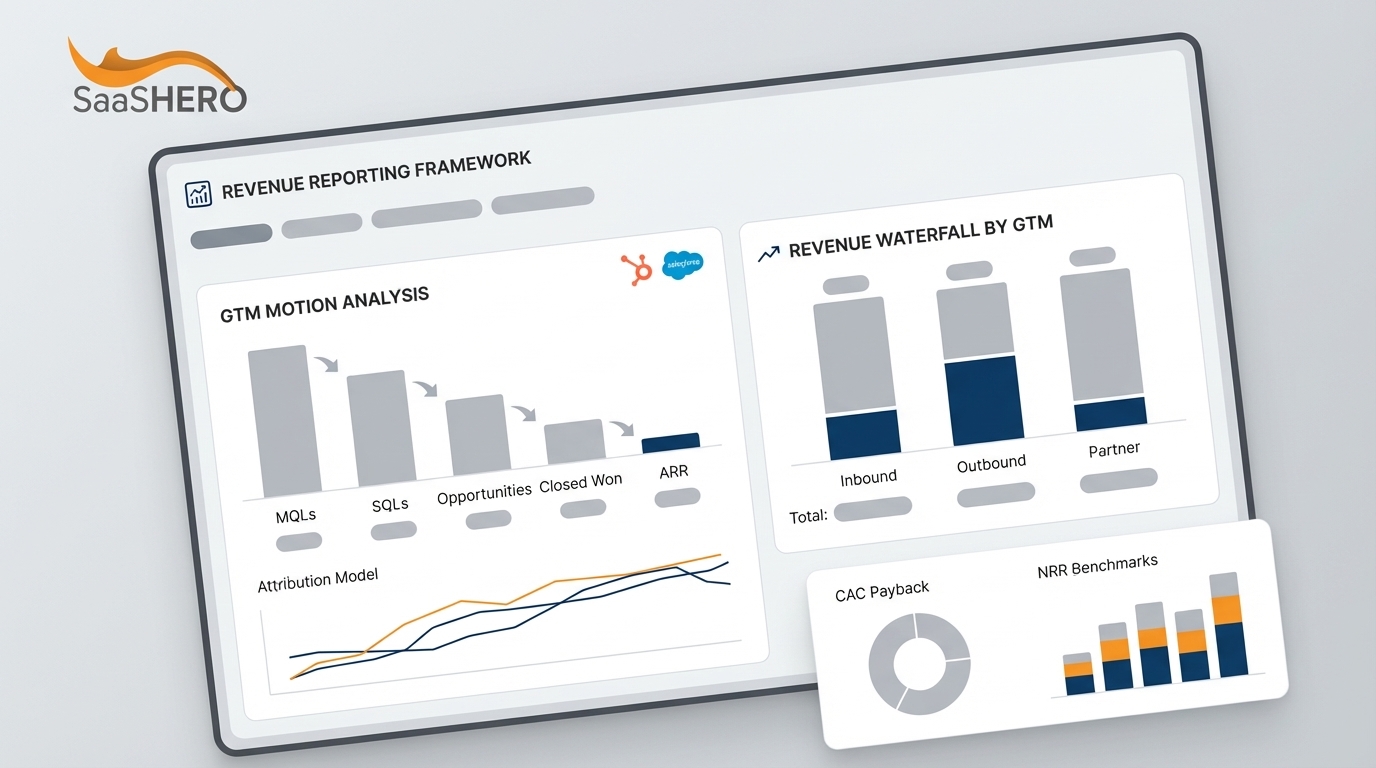
SaaSHero connects HubSpot and Salesforce data to ad platforms so teams can track ad spend against Net New ARR, pipeline value, and Sales Qualified Leads (SQLs). This connection turns marketing reports into board-ready revenue views.
Download dashboard templates to operationalize these frameworks directly inside your CRM.
Putting 5 BEs and 8-Pillar to Work in Your CRM
Configuring 5 BEs and 8-Pillar in HubSpot or Salesforce
Teams start with a focused ICP audit that sets baseline metrics and highlights high-value customer segments. Next, they configure custom properties in HubSpot or Salesforce to track the five buyer elements: decision-maker personas, purchasing behaviors, budget allocation patterns, approval processes, and business impact metrics. Automated workflows then score leads based on ICP fit and route qualified prospects into the correct sales sequences.
Cohort dashboards give monthly Net New ARR visibility by channel and GTM motion. Revenue attribution reports segment performance by ABM campaigns, competitor conquesting, and organic growth initiatives. This level of detail supports precise budget allocation and reveals the highest-ROI activities for scaling.
Building a Revenue Waterfall by GTM Motion
Accurate attribution forms the base of a reliable revenue waterfall. Teams implement first-party tracking that connects ad clicks (GCLID) through landing page conversions to closed-won opportunities in the CRM. This approach removes the “black box” where marketing claims credit for branded searches while missing true demand generation impact.
SaaSHero’s competitor conquesting methodology often delivers 650% ROI by targeting high-intent keywords such as “[Competitor] pricing” and “[Competitor] alternatives.” The strategy uses dedicated comparison landing pages, strict negative keyword hygiene to filter navigational searches, and legal-compliant messaging that highlights your product advantages.
|
GTM Motion |
2026 NRR Benchmark |
Typical CAC Payback |
Win Rate |
|
ABM |
140% |
60-80 days |
35-45% |
|
Competitor Conquesting |
125% |
45-65 days |
25-35% |
|
Organic/SEO |
135% |
30-50 days |
40-50% |
ABM strategies boost average deal value by 171% and shorten sales cycles by 40%, which directly increases closed-won ARR through higher win rates and faster pipeline velocity in target accounts. W-Shaped attribution templates then capture the complete buyer journey and credit awareness, consideration, and decision-stage touchpoints in a balanced way.
Book a revenue audit to uncover attribution gaps and roll out complete tracking across every GTM motion.
How SaaSHero Aligns Fees With Revenue Outcomes
Traditional agencies often use percentage-of-spend billing, which rewards budget inflation instead of performance gains. SaaSHero’s flat retainer model ($1,250 per month for up to $10k spend) removes this conflict and keeps recommendations focused on efficiency and revenue impact. Month-to-month agreements add a forcing function because the team must re-earn client trust and budget every 30 days.

Documented case studies show direct revenue impact. TripMaster achieved $504k Net New ARR with 650% ROI and 20% conversion rates. TestGorilla reached an 80-day CAC payback that supported a $70M Series A raise. Playvox saw a 10x decrease in Cost Per Lead with a 163% increase in lead volume, which proves that disciplined optimization can drive both efficiency and growth.

|
Spend Band |
1 Channel M2M |
1 Channel 6-Mo |
2+ Channels |
|
Up to $10k |
$1,250 |
$1,000 |
$2,500 |
|
$10k-$25k |
$1,750 |
$1,400 |
$3,000 |
|
$25k-$50k |
$2,250 |
$1,800 |
$3,500 |
This pricing structure removes micro-optimization incentives inside each spend band, so budget recommendations follow performance data instead of fee growth. Setup fees ($1,000-$2,000) and landing page design ($750) act as loss leaders that improve campaign performance and strengthen client retention.
Get matched to a senior strategist who understands your vertical and current growth stage.
Real-World SaaS Archetypes and Engagement Scenarios
The Overwhelmed Founder at roughly $5M ARR gains dedicated campaign management for $1,250 per month. This support delivers professional campaign tuning without hiring junior staff, which frees time for product work while keeping acquisition efficient.
The Frustrated VP of Marketing at $10-25M ARR needs reporting that converts vanity metrics into board-ready language such as pipeline value, SQL volume, and CAC metrics. Direct integration with existing HubSpot or Salesforce instances satisfies C-level expectations and audit requirements.
Post-Funding Scalers require aggressive competitor conquesting to hit ambitious growth targets. Rapid deployment of comparison landing pages and coordinated multi-channel campaigns allows fast scale-up while preserving the unit economics that investors expect.
Common Pitfalls When Moving to Revenue-Based Reporting
Misaligned incentives often represent the main failure mode in agency relationships. Percentage-of-spend billing creates conflicts where agencies benefit from higher budgets even when performance stalls. Flat retainer models remove this misalignment and keep recommendations focused on efficient growth.
Last-click attribution bias also weakens performance in multi-touch B2B SaaS journeys. W-Shaped models deliver more accurate revenue attribution by crediting awareness, consideration, and decision-stage interactions. This balance prevents over-investment in bottom-funnel tactics and under-investment in demand creation.
Next Steps for Capital-Efficient Growth
Revenue-based reporting frameworks give B2B SaaS teams a foundation for capital-efficient growth in 2026’s constrained environment. The 5 BEs, 8-Pillar, and W-Shaped models create scalable ways to connect GTM activity with Net New ARR outcomes. Effective rollout depends on CRM integration, accurate attribution, and company-wide alignment around shared revenue metrics.
SaaSHero acts as a turnkey partner for this transition by providing specialized expertise, proven templates, and month-to-month accountability. The combination of flat retainer pricing, senior-led execution, and revenue-focused reporting removes traditional agency conflicts and supports measurable growth.

Scale GTM with SaaSHero—Book a discovery call and start implementing revenue-based reporting frameworks that support sustainable ARR growth.
Frequently Asked Questions
How do you calculate CAC Payback Period for B2B SaaS?
CAC Payback Period equals Customer Acquisition Cost divided by Monthly Recurring Revenue, multiplied by Gross Margin percentage. For example, if CAC is $1,000, MRR is $100, and gross margin is 80%, the payback period equals 12.5 months. Best-in-class B2B SaaS companies reach payback periods under 80 days, which signals efficient capital use and strong unit economics that can support durable growth.
What are the 2026 NRR benchmarks for B2B SaaS companies?
Net Revenue Retention benchmarks vary by company size and business model. Top-quartile companies in the $15-30M ARR range typically reach an NRR of 115-120%, while best-in-class performers exceed 130%. PLG companies often achieve higher NRR because product-driven expansion increases usage and account value, with leading teams reaching 140%+ through usage-based pricing and natural expansion.
Which revenue attribution model works best for complex B2B sales cycles?
W-Shaped attribution models usually provide the most accurate revenue attribution for complex B2B sales cycles. These models credit first touch, lead creation, opportunity creation, and closed-won interactions. This structure captures the full buyer journey across multiple stakeholders and touchpoints and produces more accurate ROI calculations than last-click attribution. Time-decay models offer another option that weights recent interactions more heavily while still crediting earlier touchpoints.
How do you align cross-functional teams around revenue-based reporting?
Successful alignment starts with shared definitions of key metrics, unified data sources, and consistent incentives. Single-source-of-truth dashboards give Sales, Marketing, and Customer Success access to the same numbers. Shared KPIs such as Pipeline Velocity, SQL-to-Closed rates, and Net New ARR then require cross-functional collaboration. Regular alignment meetings and shared quarterly goals keep teams focused on common revenue outcomes instead of siloed departmental metrics.
What are the most common mistakes in implementing revenue waterfall analysis?
Frequent mistakes include incomplete attribution tracking, inconsistent data definitions across teams, and attention to vanity metrics instead of revenue outcomes. Many companies never connect ad spend to closed-won revenue because of attribution gaps between marketing platforms and CRM systems. Another common error involves analyzing cohorts at too broad a level and missing segmentation by channel, campaign, or customer traits that could guide better decisions. Strong implementation depends on technical integration, organizational alignment, and consistent measurement frameworks.