

Key Takeaways
- B2B SaaS CAC has risen to $2 per $1 ARR, so use Stripe data for precise calculations that include sales commissions and support ad spend decisions.
- Follow this 5-step process: define your period, extract new customers from Stripe, segment channels, calculate CAC, and benchmark performance.
- Use the core formula: CAC = (Sales Costs + Marketing Spend + Tools) / New Customers, exclude Stripe fees, and rely on 3-6 month windows for accuracy.
- Target 2026 benchmarks such as payback under 12 months and LTV:CAC above 3:1, with channel segmentation revealing top performers like LinkedIn at $1,500 CAC.
- Improve unit economics and close attribution gaps by booking a discovery call with SaaSHero for a Stripe-to-ARR audit.
Tools and Data You Need Before Calculating CAC
Gather your Stripe Dashboard access, a spreadsheet tool, your CRM, and ad platform data before you start CAC calculations. Stripe Billing and Revenue sections provide subscription and payment data, while Google Sheets or Excel handle the math. Your CRM, such as HubSpot or Salesforce, connects leads and deals to acquisition channels.
Use the simple rule that CAC equals total acquisition costs divided by new customers in a defined period. B2B SaaS companies must include sales salaries, commissions, and demo costs that many B2C businesses ignore. Plan 1 to 2 hours for initial setup, then about 30 minutes each month once your workflow is in place.
Align your measurement window with your sales cycle, usually a 3 to 6 month rolling period for B2B. This timing improves attribution accuracy and keeps CAC trends meaningful for longer consideration cycles.
Five-Step Framework for Stripe-Based CAC
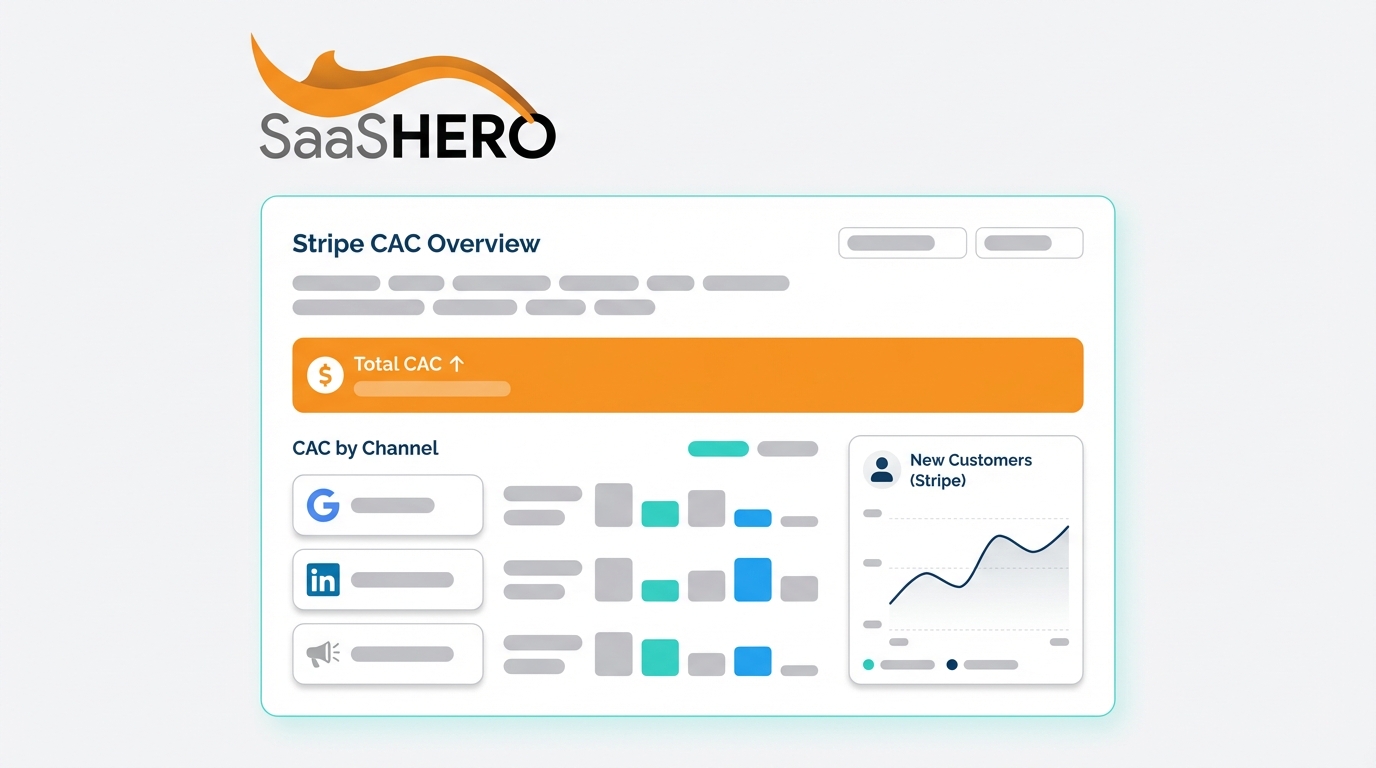
Use a clear 5-step framework so your CAC numbers stay consistent and comparable over time. First, define your measurement period and cost categories. Second, extract new customer data from Stripe. Third, segment customers by acquisition channel. Fourth, calculate CAC and payback periods. Fifth, benchmark against industry standards and refine your strategy.
Feed the framework with your measurement period, total acquisition costs, and new customer count. Acquisition costs include marketing spend, sales costs, and tools. The outputs include channel-level CAC, blended CAC, payback period, and LTV:CAC ratio. This structure creates a feedback loop where each improvement directly affects measurable financial results.
Practical CAC Formula for B2B SaaS Teams
Use this complete B2B SaaS CAC formula: CAC = (Sales Costs + Marketing Spend + Tools and Technology) / New Customers Acquired. Sales costs cover base salaries, commissions that often sit at 20 to 30 percent of ACV, sales operations, and demo expenses. Marketing spend covers advertising, content production, events, and agency fees. Tools include CRM licenses, marketing automation, and analytics platforms.
Keep Stripe processing fees out of your CAC, because they represent transaction costs rather than acquisition investments. For example, if you spend $50,000 on sales costs, $30,000 on marketing, and $20,000 on tools to win 50 new customers, your CAC equals $100,000 divided by 50, or $2,000. Use a 3 to 6 month rolling window so your CAC reflects longer B2B sales cycles and more accurate attribution.
Step-by-Step Stripe CAC Calculation for B2B SaaS
Step 1: Choose Your Measurement Period in Stripe
Start in your Stripe Dashboard under Payments and then Revenue Summary, and set your timeframe, often the previous quarter for B2B. Focus on new subscriptions instead of total revenue so you avoid expansion revenue from existing customers. Stripe Dashboard offers real-time analytics for revenue trends and supports generating reports with financial data exports that you can pull into spreadsheets or BI tools.
Step 2: Pull New Customer Data from Stripe
Use Stripe Billing or the API to identify first-time payments and new MRR additions that represent fresh customers. Remove expansion revenue, upgrades, and reactivations from churned accounts so your CAC reflects true acquisition. Stripe Dashboard provides real-time visibility into customer usage and spend via API-powered dashboards, which helps you separate new customers from existing account growth.
Teams with advanced needs can use Stripe Sigma and custom SQL queries for precise segmentation. Sigma queries allow you to filter by first charge date, product, or plan, which tightens your CAC inputs.
Step 3: Map Customers to Acquisition Channels
Assign each new customer to an acquisition source such as paid search, paid social, organic, direct, referral, or sales-led. Use UTM parameters and CRM integrations so you can track the journey from first touch through conversion. This channel mapping reveals which sources bring in the most cost-effective customers.
Use this insight to shift budget toward channels with strong CAC and away from those that underperform. Over time, this discipline improves both blended CAC and payback periods.
Step 4: Calculate CAC for Each Channel
Calculate channel-specific CAC by dividing total channel costs by the number of customers from that channel. For example, if LinkedIn Ads cost $15,000 and bring in 10 new customers, LinkedIn CAC equals $1,500. This level of detail highlights your most efficient acquisition channels.
Use these numbers to guide creative testing, bidding strategies, and landing page improvements. Channels with strong CAC and healthy conversion rates deserve more budget and closer experimentation.
Step 5: Find Your Payback Period
Calculate payback period with this formula: CAC divided by Monthly Recurring Revenue multiplied by Gross Margin Percentage. Best practices for 2026 emphasize CAC under $40 per dollar of ARR, payback periods less than 90 days, and LTV:CAC ratios of 3:1 or higher for sustainable growth. An 80 day payback period, like SaaSHero achieved for TestGorilla, shows exceptional efficiency that appeals to investors.
Include sales costs in every calculation, because ignoring them can double your real CAC. Book a discovery call to implement automated GCLID-to-Stripe tracking so you close attribution gaps and gain accurate CAC numbers across all channels.
Tracking, Benchmarks, and Validation
Track success using targets such as CAC under $2,000, payback under 12 months, and LTV:CAC above 3:1. Equity-backed SaaS companies maintain a predicted LTV:CAC ratio of 5.3x, while bootstrapped companies average 4.8x. Monitor these metrics monthly using Stripe Sigma or connect Stripe to Looker Studio for automated dashboards.

Watch for dark funnel attribution, where buyers research across many touchpoints before they convert. This pattern hides the true impact of upper funnel campaigns. Address these gaps with consistent UTM tracking, CRM integration, and first-party data collection across your website and product.
Advanced CAC Analysis by Segment and Value
Break down CAC by customer traits such as company size, industry, or deal value to uncover profitable segments. Enterprise customers usually show higher CAC but much higher LTV, while SMB customers often convert faster with lower acquisition costs. Segment the customer base to understand CAC vs LTV for each segment, identifying which segments are worth investing in more.
Calculate LTV:CAC by multiplying average customer lifespan by monthly recurring revenue and gross margin, then dividing by CAC. This ratio highlights channels and segments that deliver the strongest long term value. Mature teams use predictive analytics to estimate LTV from early usage and engagement signals.
Scale your CAC optimization with SaaSHero’s full marketing team starting at $2,500 per month for channel management and conversion rate improvements.
Action Plan and Next Steps
Accurate Stripe CAC requires consistent data extraction, full cost coverage, and ongoing refinement. Run the 5-step process each month, keep CAC segmented by acquisition channel, and compare your numbers to current benchmarks. Aim for payback under 12 months and LTV:CAC above 3:1 to support durable growth.
Next, connect your ad platforms to Stripe with automated tracking, build monthly CAC dashboards, and test channel-specific strategies. Partner with SaaSHero for a comprehensive Stripe-to-ARR audit and a month-to-month growth engagement focused on measurable revenue results.

Frequently Asked Questions
How long does it take to calculate CAC from Stripe data?
Most teams need 1 to 2 hours of initial setup to define data exports, cost categories, and reporting templates. After setup, monthly CAC updates usually take about 30 minutes. Automation and standardized reports reduce this time further as your process matures.
Should B2B SaaS companies include sales costs in CAC calculations?
B2B SaaS companies should always include full sales funnel costs in CAC calculations. These costs include base salaries, commissions, sales operations, and demo expenses. Leaving out sales costs can underestimate CAC by 50 to 100 percent and cause poor budget decisions and unrealistic growth plans.
What are the 2026 CAC benchmarks for B2B SaaS companies?
Median CAC for B2B SaaS companies usually falls between $1,000 and $3,000, depending on deal size and sales complexity. Top performers reach payback in under 12 months and maintain LTV:CAC ratios above 3:1. Enterprise-focused companies accept higher CAC because their customer lifetime value rises in proportion.
How can B2B SaaS companies reduce high CAC?
Reduce high CAC by improving conversion rates with stronger landing pages and clearer offers. Use negative keywords in paid search, run high intent competitor campaigns, and streamline your sales process. Content marketing and SEO also lower CAC over time by generating organic leads with better close rates.

How does Stripe integrate with CRM systems for CAC tracking?
Stripe connects to major CRM platforms such as HubSpot and Salesforce through native integrations and APIs. These connections support automatic lifecycle tracking from first lead capture through subscription activation. This visibility links acquisition costs to revenue and enables accurate CAC calculations across the full customer journey.