

Key Takeaways
- Use a 10-step monthly tracking system that connects Facebook Pixel data to CRM revenue outcomes for accurate B2B SaaS performance measurement.
- Audit Pixel events and UTM parameters first to capture all possible data despite privacy restrictions like iOS 14+.
- Target 2026 benchmarks: CPC under $3, CPL under $100, ROAS above 3x, and CAC payback under 90 days for sustainable growth.
- Review top and bottom ads by breakdowns, scale winners with ROAS above 3x, and turn off underperformers with CTR below 0.8%.
- Partner with SaaSHero via a discovery call to get custom templates and expert implementation for your Facebook ad revenue tracking.

Tracking Prerequisites for Reliable Facebook Ad Revenue Data
Set up your tracking stack before you start monthly reporting. You need Meta Ads Manager with a correctly configured Pixel, Google Analytics 4 with Google Tag Manager for UTM management, and a CRM such as HubSpot or Salesforce for revenue attribution.
Know your core B2B SaaS metrics. Sales Qualified Leads represent prospects ready for sales engagement. CAC payback shows how quickly ad spend returns through gross margin. An LTV to CAC ratio above 3:1 signals sustainable growth. Facebook’s default attribution window uses 28-day click tracking, but B2B SaaS companies often perform better with custom windows of at least 7-day view and 30-day click.
Plan for 2 to 4 hours for initial setup and about 1 hour each month for reporting. Expect attribution gaps from dark funnel activity. Server-side Conversions API reduces these gaps by capturing events that browser-based tracking misses.
Your 6-Step Monthly Facebook Ads Tracking Rhythm
Follow this monthly cadence for Facebook ad performance tracking. First, audit Pixel and UTM parameters for data accuracy. Second, build custom Ads Manager reports with revenue-focused columns. Third, integrate CRM data for complete attribution. Fourth, benchmark performance against 2026 industry standards. Fifth, analyze top and bottom-performing ads for clear improvement ideas. Sixth, scale profitable campaigns and shut down underperformers.
Step-by-Step Facebook Ad Tracking for B2B SaaS
Step 1: Audit Pixel in Events Manager Navigate to Events Manager and confirm that Purchase and Lead events fire correctly. Test Pixel installation using Meta’s diagnostic tools to reach a complete event capture rate. For iOS 14+ compliance, add server-side Conversions API alongside your browser Pixel to keep tracking accurate despite privacy rules.
Step 2: Verify UTM Consistency Confirm that every Facebook ad uses consistent UTM parameters that flow into Google Analytics 4. Inconsistent parameter naming often breaks attribution. Use a standard structure with source=facebook, medium=paid-social, and campaign names that match your Ads Manager naming system.
Step 3: Build a Custom Ads Manager Report Create a custom report in Ads Manager with columns for Amount Spent, ROAS, Cost Per Click, and Cost Per Lead. Add breakdowns by Ad ID to see performance for each creative. Save this report template for monthly use and easy exporting.
Step 4: Connect CRM for Revenue Attribution Configure your CRM to capture Google Click IDs and Facebook Click IDs from form submissions. This setup links the first ad click to closed-won revenue. Modern attribution platforms integrate with HubSpot, Salesforce, and other CRMs and can automate much of this process.
Step 5: Calculate Revenue-Focused KPIs Use clear formulas that connect ad spend to revenue. CAC Payback equals Customer Acquisition Cost divided by Monthly Gross Margin per Customer. If demo requests convert to SQLs at 15% and SQLs close at 20%, track each stage monthly. Prioritize revenue impact instead of raw lead volume.
Step 6: Compare Results to 2026 B2B SaaS Benchmarks Review your metrics against current industry standards.
|
Metric |
B2B SaaS Benchmark 2026 |
Good Threshold |
HR Tech Example |
|
CPC |
$2-5 |
<$3 |
$2.50 |
|
CPM |
$15-30 |
<$20 |
$18 |
|
CPL |
$50-150 |
<$100 |
$75 |
|
CTR |
0.8-1.5% |
>1% |
1.2% |
Step 7: Review Top and Bottom Ads Use Ads Manager breakdowns to find winning creative themes and audience segments. Turn off ads with CTR below 0.8%, since they signal weak audience and message alignment and waste budget on low-quality traffic.
Step 8: Export Data to a Looker Studio Template Connect your data sources to a dashboard that refreshes automatically. Include month-over-month trends, funnel conversion rates, and revenue by campaign. Book a discovery call for a custom template that matches your CRM and attribution setup.

Step 9: Run Weekly Spot-Checks Check for data issues each week. Common problems include privacy settings, Pixel errors, and CRM sync failures. Facebook Ads Manager’s native reporting has limited depth for long-term data, so validate numbers against CRM records regularly.
Step 10: Apply Clear Optimization Decisions Increase budgets slowly on campaigns with ROAS above 3x. Pause or rebuild campaigns that miss your CAC payback targets. Record each decision in your monthly report so you can see the impact of changes over time.
Evaluating Facebook Ad Performance for B2B SaaS
Strong B2B SaaS Facebook performance depends on business outcomes, not only platform metrics. ROAS above 2x works as a starting reference, but mature SaaS teams should aim for 3x or higher to cover long sales cycles and higher acquisition costs.
Track CAC payback periods under 90 days, SQL conversion rates above 10%, and improvements in pipeline velocity. Include these metrics in your monthly dashboard along with CPC, CPM, and CTR. Multi-touch attribution models reveal the real impact of Facebook ads in complex journeys where prospects touch several channels before becoming customers.
Attribution gaps still create confusion. Retargeting campaigns often look weak in Facebook’s native reporting but can drive up to 40% of pipeline when measured through CRM data. Revenue-focused tracking prevents you from cutting campaigns that quietly support deals.
Advanced Facebook CPM Benchmarks and Cross-Channel Strategy
Advanced B2B SaaS teams compare Facebook results with LinkedIn and Google Ads to understand each channel’s role. Average CPL for lead generation campaigns reached $27.66 in 2025, which reflects a 20% year-over-year increase and pushes marketers toward sharper targeting and stronger creative.
Meta Advantage+ automated rules can shift budget based on performance thresholds, but they need close monitoring so the algorithm stays aligned with revenue goals. Scaling SaaS companies that spend at least $3,000 per month often benefit from specialized agencies that bring advanced attribution models and cross-channel expertise. Book a discovery call to see how professional management can raise Facebook ad ROI while reducing internal workload.

Next Steps: Monthly Facebook Ads Tracking Checklist
Consistent, revenue-focused tracking turns Facebook into a predictable B2B SaaS growth channel. Start with a Pixel audit and UTM standardization, then build custom reports that connect ad spend to pipeline and closed revenue. As your system matures, add multi-touch attribution and automated optimization rules.
Newer programs should focus on baseline metrics and a steady monthly reporting rhythm. Expect 1 to 2 months before you see clear trends and reliable optimization ideas. Experienced marketers can add AI-powered rules and cross-platform attribution for more advanced control.
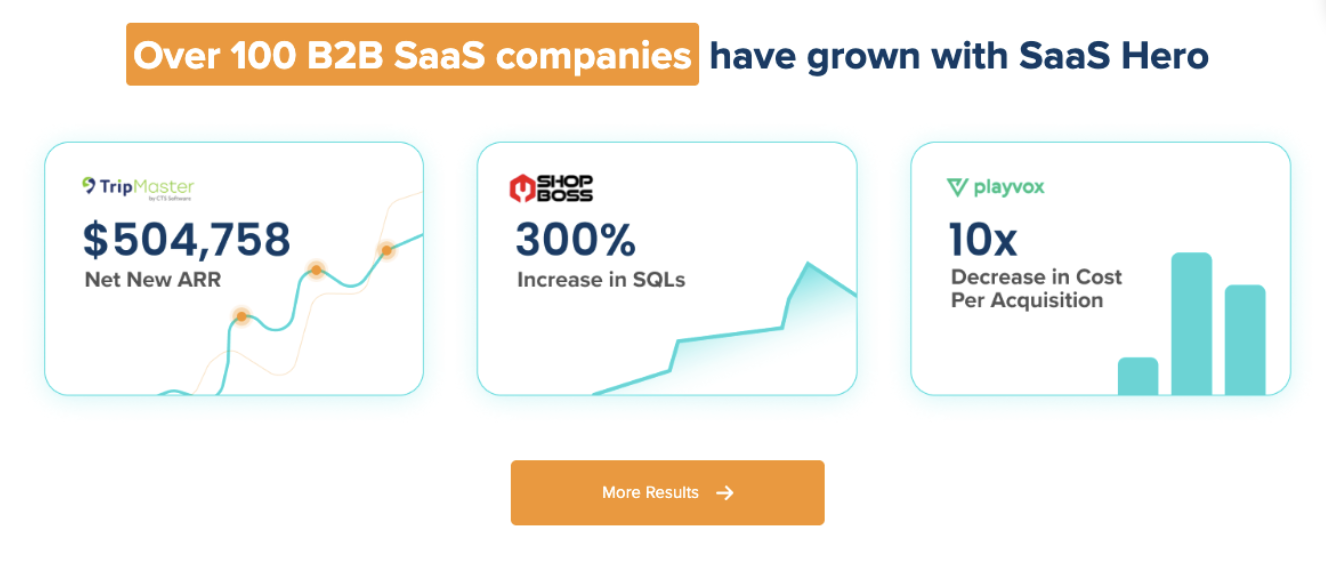
Partner with SaaSHero, a focused B2B SaaS marketing agency, to speed up your Facebook ad performance and drive measurable Net New ARR. Book a discovery call to review your tracking setup and uncover new optimization opportunities.
Frequently Asked Questions
How do B2B SaaS companies track Facebook ad performance?
Set up a monthly tracking system that connects Facebook Pixel data with CRM revenue outcomes. Build custom Ads Manager reports that highlight Cost Per Lead, ROAS, and conversion rates, and use UTM parameters to follow the full customer journey. Integrate with HubSpot or Salesforce to measure CAC payback and SQL generation. Most teams uncover useful optimization insights within 1 to 2 months of consistent tracking.
What are strong Facebook CPM benchmarks for SaaS in 2026?
B2B SaaS companies should aim for CPM below $20, while industry averages range from $15 to $30. Higher CPMs can still work for narrow audiences or competitive sectors such as HR Tech or Cybersecurity. Focus on Cost Per Lead and ROAS instead of CPM alone, since qualified leads can justify higher impression costs in complex B2B sales cycles.
How can B2B SaaS teams fix poor Facebook ad ROAS?
Begin with an audit of audience exclusions and targeting to remove unqualified traffic. Review landing page conversion rates and confirm that ad messaging matches page content. Check attribution settings and CRM connections so you capture the full journey. Many B2B SaaS companies see ROAS improve once they adopt multi-touch attribution that reflects longer sales cycles.
Can small SaaS companies track Facebook ad performance effectively?
Small SaaS teams can track performance effectively by starting simple. Focus on Cost Per Lead first instead of complex revenue attribution. Use consistent UTM parameters and a basic Pixel setup before moving into deeper CRM integration. Maintain a monthly reporting cadence and compare results to industry benchmarks. As revenue grows, add more advanced attribution and automation tools.
How often should B2B SaaS companies review Facebook ad performance?
Run full performance reviews each month and quick spot-checks each week. Monthly reviews provide enough data for meaningful insights without reacting to noise. Weekly checks help you catch Pixel issues, budget pacing problems, or CRM integration failures before they damage results.