

Key Takeaways
- B2B SaaS teams should track 10 real-time revenue metrics, including CPL under $200, 20% Lead Velocity Rate growth, and Net New ARR attribution, to replace vanity metrics with revenue-focused insights.
- Top transparent reporting tools include HubSpot (9/10 transparency), Salesforce + Looker, Looker Studio, and SaaSHero Reporting (10/10) with CRM sync and ARR tracking.
- CRM-integrated dashboards with GCLID and UTM tracking, automated alerts, and revenue-first views remove data silos and support fast, confident decisions.
- Case studies show clear impact: TripMaster reached 650% ROI and $504k Net New ARR, TestGorilla hit an 80-day payback, and Playvox cut CPL by 10x while growing lead volume 163%.
- SaaSHero’s flat-fee, month-to-month model delivers conflict-free, transparent reporting that supports durable B2B SaaS growth—schedule a discovery call today.
Top 10 Real-Time Lead Gen Metrics B2B SaaS Teams Need in 2026
High-performing B2B SaaS companies in 2026 track these ten metrics in real time to improve lead generation performance.
1. Cost Per Lead (CPL)
Formula: Total marketing spend ÷ number of leads generated
Benchmark: Under $200 for strong B2B SaaS performance
Track CPL by channel to find your most efficient acquisition sources and cut wasteful spend.
2. Lead Velocity Rate (LVR)
Formula: (Current month qualified leads – last month) ÷ last month × 100
Benchmark: 20% month-over-month growth signals a healthy pipeline
LVR acts as a leading indicator for future revenue and predicts growth before conversions close.
3. Lead-to-Customer Conversion Rate
Formula: (New customers ÷ total leads) × 100
This metric connects marketing activity to revenue and reveals how effective your lead generation really is.
4. Net New Annual Recurring Revenue (ARR)
Track ARR attribution by marketing channel to see which campaigns create real revenue growth instead of just more leads.
5. Sales Qualified Lead (SQL) Rate
Formula: SQLs ÷ Marketing Qualified Leads × 100
This rate measures the quality of leads that marketing hands to sales.
| Metric Type | Vanity Example | Revenue-Focused Alternative |
|---|---|---|
| Volume | Total website impressions | Net New ARR by channel |
| Engagement | Click-through rate | Lead velocity rate |
| Cost | Cost per click | Customer acquisition cost |
Book a discovery call to see how TripMaster used these metrics to improve conversion rates by 20%.
6. Pipeline Velocity
Pipeline velocity shows how quickly leads move through each sales stage and highlights bottlenecks that delay revenue.
7. Lead Quality Score
This score blends lead source, behavior, and conversion data to improve ROI by focusing your team on high-value prospects.
8. Customer Acquisition Cost (CAC) Payback Period
Target: Under 80 days for healthy cash flow
This metric shows how quickly marketing and sales investments return through customer revenue.
9. Lead Response Time
Target: Within 1 hour for strong conversion potential
Faster speed-to-lead improves conversion rates and strengthens your competitive position.
10. MQL to Revenue Attribution
This metric tracks the full journey from first touch to closed-won revenue and supports accurate ROI calculations.
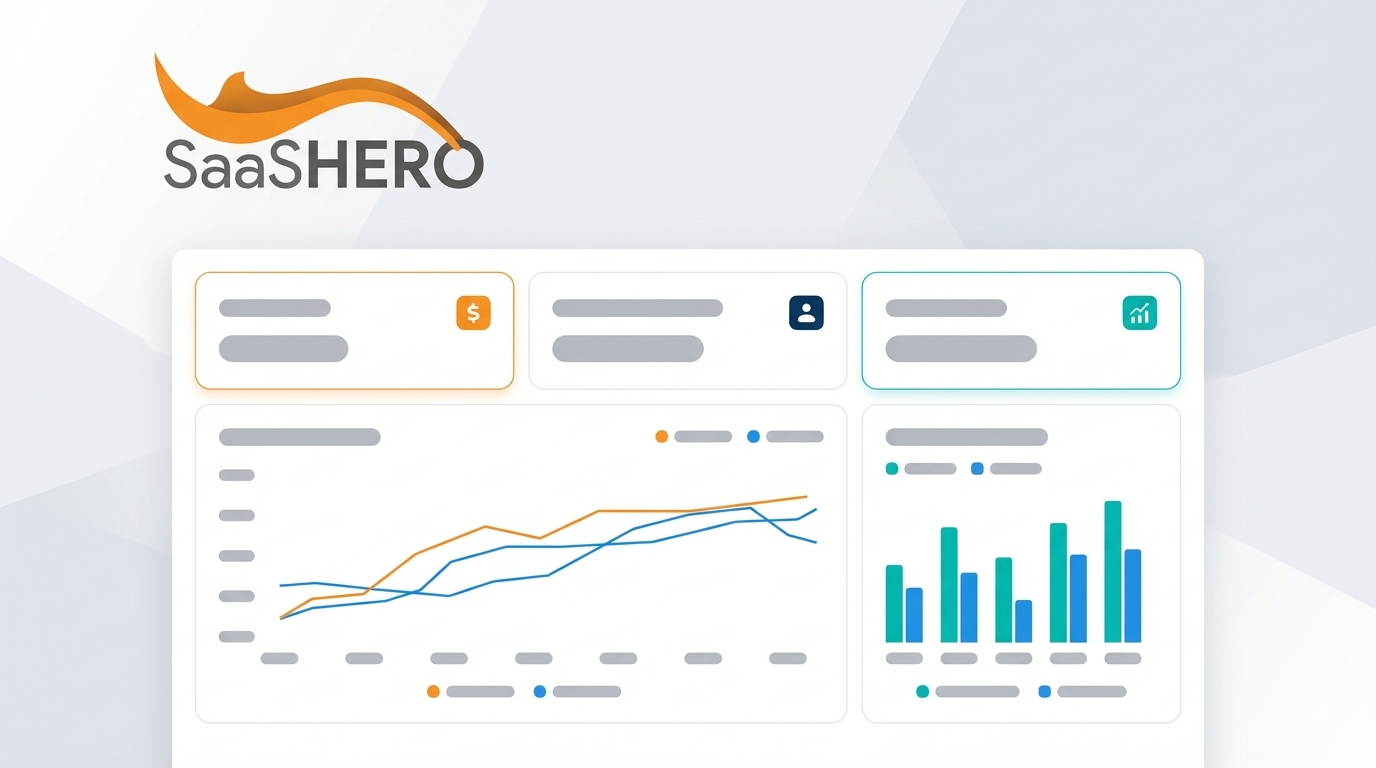
Transparent Reporting Tools That Support Real-Time SaaS Dashboards
Modern reporting tools should remove data silos and give you a single view of your lead generation funnel.
Use this comparison to evaluate leading transparent reporting options.
| Tool | Real-Time Integration | SaaS-Specific Features | Transparency Score |
|---|---|---|---|
| HubSpot | Native CRM + Marketing Hub | Lead scoring, attribution reporting | 9/10 |
| Salesforce + Looker | API-based with custom dashboards | Advanced pipeline analytics | 8/10 |
| Looker Studio | Google Ads + Analytics integration | Free tier, custom visualizations | 7/10 |
| SaaSHero Reporting | Multi-platform CRM sync | Net New ARR tracking, sophisticated attribution | 10/10 |
Top data visualization tools in 2026 include Tableau with AI agents and Looker with stronger data governance, but many platforms still lack SaaS-specific attribution models for accurate lead generation reporting.
Use these criteria when you select a transparent reporting tool.
- Real-time data sync with your CRM
- GCLID-to-customer tracking support
- Multi-channel attribution models
- Automated anomaly detection and alerts
- Revenue-based reporting instead of pure lead volume
Book a discovery call to explore flat-fee, month-to-month reporting that supports revenue decisions.
Building CRM-Integrated Real-Time Dashboards Step by Step
Effective real-time dashboards rely on tight integration between ad platforms and your CRM.
Use this four-step process to build dashboards that your team will actually use.
Step 1: Implement Tracking Infrastructure
Set up GCLID and UTM tracking across every paid campaign. This tracking creates clean attribution from ad click to customer.
Step 2: Configure CRM Synchronization
Connect your ad platforms to HubSpot, Salesforce, or your CRM of choice. Confirm that lead source data flows automatically without manual uploads.
Step 3: Build Revenue-Focused Dashboards
Design dashboards that highlight Net New ARR, pipeline velocity, and lead quality scores. Deprioritize vanity metrics such as impressions and basic click counts.
Step 4: Set Up Automated Alerts
Configure Slack or email alerts for meaningful shifts in key metrics so your team can react quickly.
| Common Pitfall | Business Impact | SaaSHero Solution |
|---|---|---|
| Data silos between platforms | Inaccurate attribution, wasted spend | Unified tracking with custom integrations |
| Focus on vanity metrics | Misaligned optimization efforts | Revenue-first reporting framework |
| Manual data compilation | Delayed insights, human error | Automated dashboard updates |
Our approach also covers negative keyword strategy and real-time Slack embeds for instant performance visibility. Book a discovery call to roll out this dashboard setup with your team.
SaaSHero Case Studies That Connect Transparent Metrics to Revenue
Client results show how transparent, real-time metrics translate into revenue growth.

1. TripMaster: $504,758 Net New ARR
Challenge: Transit software company needed faster growth.
Solution: Comprehensive paid search and paid social with rigorous CRO testing.
Results: 650% ROI and a 20% conversion rate from paid search.

2. TestGorilla: 80-Day Payback Period
Challenge: HR tech startup needed proof of unit economics for a Series A round.
Solution: Aggressive channel scaling with strict efficiency guardrails.
Results: $70M Series A raised and more than 5,000 new customers added.
3. Playvox: 10x CPL Reduction
Challenge: CX software company faced inefficient spend and weak targeting.
Solution: Full account rebuild with competitor conquesting and negative keyword strategy.
Results: 163% lift in lead volume with a 10x lower CPL.

| Client | Before Metrics | After Metrics | ROI Improvement |
|---|---|---|---|
| TripMaster | Standard conversion tracking | $504k Net New ARR | 650% |
| TestGorilla | Long payback periods | 80-day payback | Series A funding |
| Playvox | High CPL, low volume | 10x lower CPL, 163% volume | 1000%+ |
These outcomes come from a flat retainer model that removes the percentage-of-spend conflicts common with traditional agencies. Budget recommendations rest on performance data instead of fee growth.
FAQ: Real-Time Metrics and Transparent Reporting for B2B SaaS
Most Critical Real-Time Lead Generation Metrics for B2B SaaS
Key metrics include Cost Per Lead with a benchmark under $200, Lead Velocity Rate at 20% month-over-month growth, Net New ARR attribution, SQL conversion rates, and CAC payback periods under 80 days. Each metric connects directly to revenue instead of surface-level engagement.
Integrating HubSpot for Transparent Lead Generation Reporting
Start by rolling out GCLID tracking across every paid campaign, then sync that data into HubSpot’s native attribution tools. Build custom Looker Studio dashboards that tie ad spend to closed-won revenue so you can see ROI across the full funnel.
Difference Between Lead Velocity and Lead Volume
Lead velocity tracks the growth rate of qualified leads month over month and predicts future revenue. Lead volume only counts total leads and ignores quality and conversion potential. Focusing on velocity supports sustainable growth, while a volume-only focus often increases spend on unqualified traffic.
Tools With Strong SaaS ARR Tracking Capabilities
HubSpot or Salesforce paired with Looker Studio gives you real-time Net New ARR tracking, pipeline velocity views, and multi-touch attribution tailored to B2B SaaS. SaaSHero sets up and manages these integrations within our performance marketing engagements.
How SaaSHero Differs From Traditional Marketing Agencies
SaaSHero uses flat monthly retainers instead of percentage-of-spend pricing, which removes budget conflicts. The team focuses on revenue metrics such as Net New ARR, offers month-to-month agreements, and delivers transparent, real-time reporting that connects directly to your CRM.

Conclusion: Turn Lead Gen Reporting Into a Revenue Engine
The 2026 B2B SaaS market rewards teams that use precise, transparent, revenue-focused metrics. Companies that rely on vanity metrics and black-box reporting struggle to defend budgets and scale efficiently.
By adopting the ten real-time lead generation metrics in this guide and pairing them with transparent tools and CRM integration, your team can improve campaigns, lower acquisition costs, and grow revenue faster.
Book a discovery call to share your metrics challenges and see how a transparent, flat-fee model can support measurable growth for your B2B SaaS company.