




Written by: Aaron Rovner, Founder, Saas Hero
Key Takeaways
- Traditional ABM breaks in a recession because agencies earn more when you spend more, not when you add ARR, and last-click attribution hides true CAC.
- Refining ICP to recession-resilient verticals and roles using closed-won data cuts CAC and speeds payback by focusing spend on the highest-converting segments.
- Expansion-first targeting and competitor-conquest campaigns deliver faster payback by reaching accounts already in-market or already using your product.
- Replacing vanity metrics (MQLs, impressions) with account-level KPIs such as Net New ARR, CAC payback, Expansion ARR %, and NRR gives CFOs the capital-efficiency proof they expect.
- SaaSHero’s flat monthly retainer and month-to-month model removes the structural conflicts that prevent most teams from executing this playbook; schedule a discovery call to turn your next 90 days into verifiable Net New ARR.
Why Traditional ABM Fails in a Recession
Capital-efficiency mandates now define what CFOs accept as proof of marketing value. SaaS companies typically allocate a median of 8% of ARR to marketing, with combined sales and marketing spend ranging from 15-25% for scaling-stage firms, yet most of that spend flows through agencies billing 10–20% of ad spend, a model that financially rewards higher budgets regardless of performance. The agency’s revenue grows when spend grows, not when ARR grows, so incentives drift away from efficiency.
Last-click attribution deepens the problem. A buyer searches a competitor’s brand name after seeing a LinkedIn ad, reading a G2 review, and attending a webinar. The brand search receives 100% of the credit, which hides the true cost of demand generation and inflates reported ROAS. Meanwhile, only approximately 5% of B2B accounts are actively in-market at any given time, so broad keyword lists and untargeted display campaigns reach the other 95%, accounts that will not buy regardless of impression frequency.
The seven tactics that follow address these structural failures in sequence. They first narrow targeting to eliminate waste at the source, then redirect spend toward accounts with the highest probability of conversion, and finally replace the metrics that allowed these inefficiencies to persist without scrutiny.
Tactic 1: Tighten ICP to Recession-Resilient Verticals and Roles
Purpose: Eliminate budget waste on accounts outside the highest-converting segments by rebuilding ICP criteria around closed-won data.
Required inputs: CRM closed-won records from the last 12–24 months, CAC by vertical, average ACV, and CAC payback period by segment.
Step-by-step actions: Pull every closed-won deal from the last 24 months and tag each by vertical, company size, and primary buyer role. This tagging creates the segments you need for CAC and payback analysis. Use these segments to calculate CAC payback for each group. Retire any segment where payback exceeds 18 months, because those segments burn capital faster than they return it. A CAC payback period over 18 months at the $10M ARR stage indicates a broken motion and should trigger immediate ICP revision.
Decision criteria: Retain verticals where payback is under 12 months and ACV is above the median. Pause spend on all other segments until the 90-day review.
Validation checkpoint: ICP fit rate, the percentage of new pipeline accounts matching the refined ICP, should reach 70% or higher by Day 30.
The table below summarizes how this first tactic connects your inputs, KPI, and expected ARR outcome so you can track progress at a glance.
| Tactic | Primary Input | Target KPI | ARR Outcome |
|---|---|---|---|
| Tighten ICP | Closed-won CRM data | ICP Fit Rate ≥70% | Reduced CAC, faster payback |
Tactic 2: Switch to Expansion-First Targeting Using Existing Customer Data
Once you have tightened ICP and focused new-logo spend on the highest-converting segments, redirect part of that budget toward accounts that already trust you. Expansion campaigns against current customers usually reach payback faster because the relationship and proof already exist.
Purpose: Shift a meaningful share of budget toward upsell and cross-sell motions where payback is structurally shorter.
Required inputs: Product usage data, feature adoption rates, and CS health scores by account.
Step-by-step actions: Identify accounts in the top quartile of product usage that have not yet purchased the next tier or adjacent module. Use these accounts to build LinkedIn audience segments with job title and company filters. Run targeted ads that promote the specific feature or tier they have not adopted yet. Milestone-based or value-moment triggers at usage thresholds convert 5-18% of freemium users in SaaS product-led growth models, and the same principle applies to paid expansion.
Decision criteria: Allocate at least 20% of total paid media budget to expansion campaigns. At the $20M+ ARR stage, expansion should account for 30–40% of new bookings; if under 20%, the product lacks stickiness.
Validation checkpoint: Track Expansion ARR as a percentage of total new ARR each month in the shared dashboard.
Tactic 3: Activate Only High-Intent Signals via Competitor-Conquest Campaigns
Purpose: Capture accounts already evaluating alternatives by intercepting pricing, complaint, and comparison search intent.
Required inputs: Competitor keyword lists segmented by intent type and third-party intent data from Bombora, G2, or TechTarget.
Step-by-step actions: Segment competitor keywords into three buckets: pricing intent, complaint intent, and review intent, because each bucket reflects a different stage of dissatisfaction and needs different messaging. Build dedicated landing pages for each bucket with copy that matches the ad promise so visitors see continuity from query to headline. Apply negative keywords for navigational queries, such as the competitor brand name alone, to remove wasted impressions from users who only want the login page. Combining first-party, third-party intent, and trigger-event signals improves the accuracy of predicting conversion.

Common mistake: Sending competitor-intent traffic to a generic homepage. This mismatch hurts Quality Score and conversion rate at the same time.
Validation checkpoint: Compare cost per SQL from competitor campaigns against non-competitor campaigns at Day 45.
Tactic 4: Build ROI-First Messaging and Comparison Pages for CFO Concerns
Competitor-conquest campaigns bring in high-intent traffic, but that traffic will not convert without pages that speak directly to the CFO’s economic questions. This tactic creates the conversion layer that turns those clicks into qualified pipeline.
Purpose: Speak to the economic buyer, usually the CFO or VP of Finance, who now enters B2B purchase cycles much earlier.
Required inputs: Total Cost of Ownership data, customer ROI case studies, and G2 or Capterra review aggregates.
Step-by-step actions: Build a dedicated comparison page for each primary competitor. Open with a TCO table that shows three-year cost including implementation, support, and seat pricing. Embed video case studies from customers who switched, because video case studies often outperform text-only versions for expansion and switching decisions. Add a payback period calculator if engineering resources allow. Keep all competitor references factual, with no competitor logos and no copy that could be interpreted as passing off.

Validation checkpoint: Measure comparison page conversion rate to demo request and compare it to the site average at Day 60.
Need help building ROI-first comparison pages that convert CFOs? Schedule a discovery call to review your current competitor positioning.
Tactic 5: Align Sales, Marketing, and CS on Shared Account-Level Dashboards
Purpose: Replace siloed reporting with a single account-level view that shows pipeline value, engagement depth, and expansion signals for every tier-1 account.
Required inputs: CRM such as HubSpot or Salesforce, ad platform data via GCLID or UTM passthrough, and CS health scores.
Step-by-step actions: Connect ad click data to CRM contact records using GCLID or UTM passthrough, which creates the foundation for an account-level view that blends marketing and sales data. After the connection is live, build a Looker Studio or HubSpot dashboard that shows engagement score, pipeline stage, open opportunities, and CS health score for each account. Share dashboard access with AEs, SDRs, and CSMs so every team works from the same account intelligence. Establish a weekly 30-minute account review cadence, because a dashboard without a decision rhythm rarely changes behavior. Companies with aligned sales and marketing teams see 24% faster revenue growth.
Common mistake: Building the dashboard but skipping the weekly review. Data without decisions does not move pipeline.
Validation checkpoint: Maintain a lead-to-account match rate above 95%, consistent with LeanData benchmarks for ABM programs using account-based routing.
Tactic 6: Replace Vanity KPIs with Account-Level Metrics
Purpose: Remove impressions, CTR, and MQL volume from executive reporting and replace them with metrics that map directly to ARR.
Required inputs: CRM revenue data, finance system ARR records, and CS churn and expansion logs.
Step-by-step actions: Audit the current metric stack and remove any metric that cannot be tied to a revenue outcome within two steps. Implement four core KPIs as the reporting standard: Net New ARR, CAC Payback Period, Expansion ARR as a percentage of total new ARR, and Net Revenue Retention. Target the 12–18 month payback benchmark established in Tactic 1 as your standard, and treat NRR of 120% or higher as a strong signal of product and expansion health.

The table below shows which vanity metrics to retire, what to replace them with, and how often to report each new KPI.
| Vanity Metric (Retire) | Account-Level Replacement | Benchmark | Reporting Cadence |
|---|---|---|---|
| MQL Volume | Net New ARR | Positive QoQ growth | Monthly |
| Impressions / CTR | CAC Payback Period | Under 18 months | Quarterly |
| Lead Volume | Expansion ARR % | 30–40% of new bookings | Monthly |
| Form Fills | Net Revenue Retention | 120%+ strong | Monthly |
Ready to replace your vanity dashboard with an ARR-first reporting model? Book a discovery call.
Tactic 7: Run a 90-Day Phased Rollout with Week-by-Week Actions
Tactics 1 through 6 define what to change. Tactic 7 defines when to change it and in what order, so your team avoids overload and still hits clear validation checkpoints.
Purpose: Sequence the six preceding tactics into a structured rollout that avoids simultaneous change overload and produces measurable checkpoints.
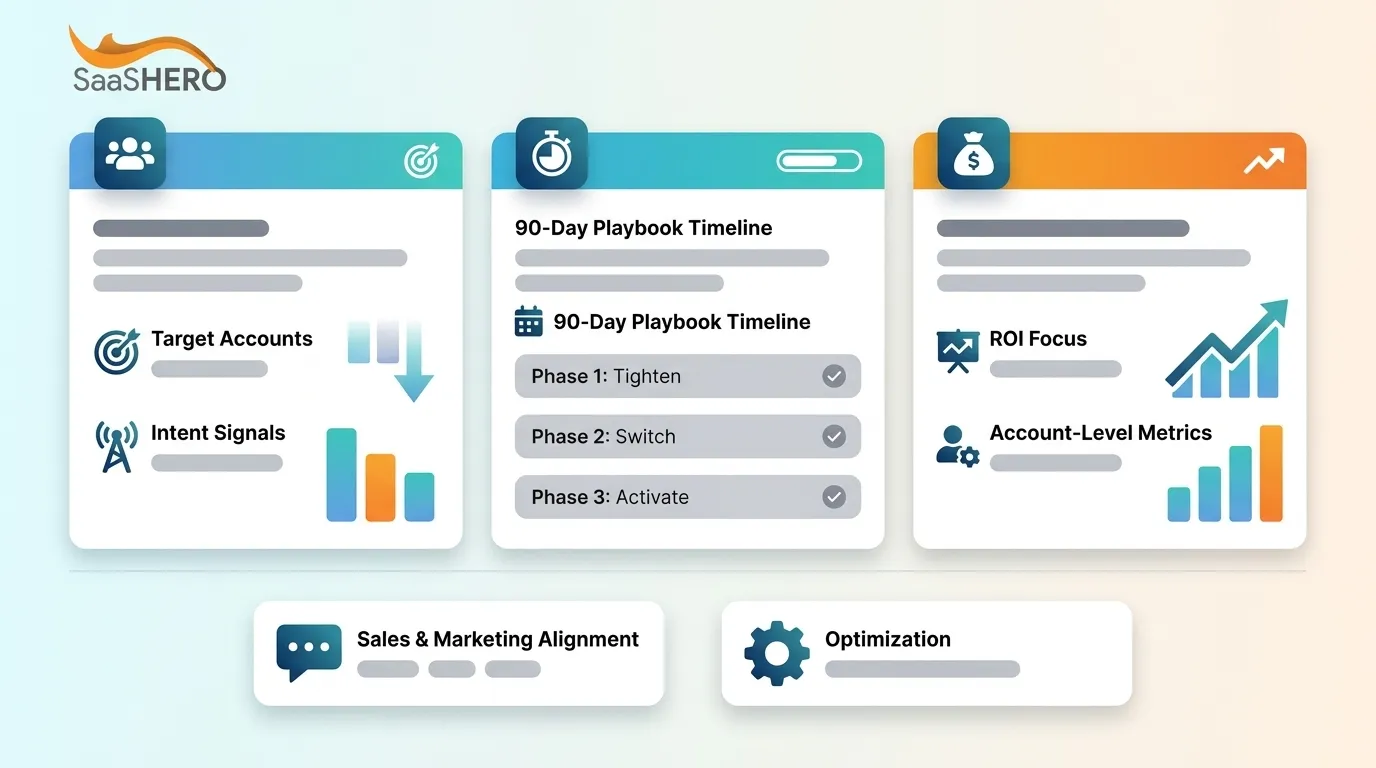
The table below breaks the 90-day execution into three phases and shows which tactics to activate in each phase, along with the validation checkpoint that signals readiness for the next phase.
| Phase | Weeks | Primary Actions | Validation Checkpoint |
|---|---|---|---|
| Foundation | 1–3 | ICP audit, CRM tagging, dashboard build, negative keyword hygiene | ICP fit rate baseline established |
| Activation | 4–7 | Competitor-conquest campaigns live, comparison pages deployed, expansion audience segments built | Competitor campaign SQL cost vs. baseline |
| Optimization | 8–12 | Weekly account review cadence, metric stack audit complete, budget reallocation to top-performing segments | CAC payback trend, Expansion ARR %, NRR |
Budget bands: Sub-$10k per month teams should prioritize Tactics 1, 2, and 6 before running paid competitor campaigns. Teams at $25k–$50k per month can run all seven tactics in parallel with dedicated campaign management.
Common mistake: Launching competitor-conquest campaigns before comparison pages are live. Traffic from high-intent competitor queries that lands on a generic homepage rarely converts, so budget disappears before the tactic can be validated.
90-Day Checklist and Next Steps by Team Size
Founder-led teams (sub-$5M ARR): Complete an ICP audit using closed-won CRM data, implement GCLID passthrough to CRM, build one competitor comparison page, and retire MQL reporting in favor of SQL and pipeline value.
Mid-market teams ($5M–$15M ARR): Complete all founder-led steps, activate expansion-first LinkedIn audiences, establish a weekly account review cadence with Sales and CS, and deploy ROI-first comparison pages for your top two competitors.
Scale-up teams ($15M–$25M ARR): Complete all mid-market steps, implement a full account-level dashboard in Looker Studio or HubSpot, and run multi-threaded outreach to 5–8 stakeholders per tier-1 account. Deals with 5+ multi-threaded stakeholder relationships close at 30% versus 5% for single-threaded deals, per Gong analysis of 1.8M opportunities. Allocate the 30–40% expansion target discussed in Tactic 2 to your new bookings forecast.
Frequently Asked Questions
How long does setup typically take before the first campaigns are live?
For most B2B SaaS teams, the foundation phase that includes ICP audit, CRM tagging, GCLID passthrough, and negative keyword hygiene takes two to three weeks. Competitor-conquest campaigns and comparison pages usually go live in weeks four and five if landing page assets move in parallel. SaaSHero’s onboarding includes a one-time setup fee that covers tracking architecture, strategy build, and initial audit, which shortens the timeline compared to building these systems internally from scratch.
Which internal roles are required to execute this playbook?
You need a marketing owner to manage campaign inputs and reporting, a sales leader to join weekly account reviews, and a CS contact to provide health scores and expansion signals. RevOps or a CRM administrator should handle GCLID passthrough and dashboard build. SaaSHero functions as an embedded extension of this team, running paid media execution, landing page design, and reporting architecture so internal headcount stays lean.
How do teams adapt these tactics on a sub-$10k monthly ad spend?
Teams at sub-$10k monthly spend should sequence tactics instead of running everything in parallel. Start with Tactic 1, ICP tightening, and Tactic 6, the metric stack audit, in weeks one through three, because both are zero-cost structural changes. Activate one competitor-conquest campaign that targets the single highest-intent keyword cluster in weeks four through six. Run expansion-first LinkedIn audiences at roughly $1,500–$2,500 per month, which often delivers the fastest payback at this budget level because the audience already uses your product. Avoid spreading budget across more than two channels until one channel reaches a validated CAC payback under 15 months.
How often should intent data be refreshed to maintain targeting accuracy?
Refresh third-party intent signals from providers such as Bombora, G2, and TechTarget at least weekly. Buying-committee intent is highly time-sensitive, and a spike in competitor pricing searches or G2 review activity usually signals an active evaluation window of two to four weeks. Configure first-party signals, including pricing page visits and product usage thresholds, to trigger automated sequences in near real time through CRM workflow rules. Recalculate account engagement scores in the shared dashboard at least weekly so the sales team focuses on accounts at peak intent instead of accounts that were hot 60 days ago.
Conclusion: Turn Every Ad Dollar into Net New ARR
The seven tactics in this playbook share one operating principle: every dollar of paid media must connect to a revenue outcome. Tightening ICP removes waste at the source. Expansion-first targeting captures the highest-probability revenue inside your existing customer base. Competitor-conquest campaigns intercept accounts already in active evaluation. ROI-first comparison pages resolve CFO objections before the sales call. Shared account-level dashboards keep Sales, Marketing, and CS aligned to the same ARR number. Replacing vanity KPIs with Net New ARR, CAC payback, and NRR gives leadership defensible proof of capital efficiency. The 90-day phased rollout then sequences all six tactics into a manageable execution cadence with clear validation checkpoints.
SaaSHero’s flat monthly retainer and month-to-month terms remove the two structural barriers that stop most teams from executing this playbook with a partner: the percentage-of-spend conflict of interest and the 12-month lock-in that encourages complacency. The model is built to re-earn your business every 30 days by delivering measurable payback, not just attractive dashboards.
Turn your next 90 days into verifiable Net New ARR, and book a discovery call.